GameStop 2010 Annual Report Download - page 53
Download and view the complete annual report
Please find page 53 of the 2010 GameStop annual report below. You can navigate through the pages in the report by either clicking on the pages listed below, or by using the keyword search tool below to find specific information within the annual report.-
 1
1 -
2
-
3
-
4
-
5
-
6
-
7
-
8
-
9
-
10
-
11
-
12
-
13
-
14
-
15
-
16
-
17
-
18
-
19
-
20
-
21
-
22
-
23
-
24
-
25
-
26
-
27
-
28
-
29
-
30
-
31
-
32
-
33
-
34
-
35
-
36
-
37
-
38
-
39
-
40
-
41
-
42
-
 43
43 -
 44
44 -
 45
45 -
 46
46 -
 47
47 -
 48
48 -
 49
49 -
 50
50 -
 51
51 -
 52
52 -
 53
53 -
 54
54 -
 55
55 -
 56
56 -
 57
57 -
 58
58 -
 59
59 -
 60
60 -
 61
61 -
 62
62 -
 63
63 -
64
-
65
-
66
-
67
-
68
-
69
-
70
-
71
-
72
-
73
-
74
-
75
-
76
-
77
-
78
-
79
-
80
-
81
-
82
-
83
-
84
-
85
-
86
-
87
-
88
-
89
-
90
-
91
-
92
-
93
-
94
-
95
-
96
-
97
-
98
-
99
-
100
-
101
-
102
-
103
-
104
-
105
-
106
-
107
-
108
-
109
-
110
-
111
-
112
-
113
-
114
-
115
-
116
-
117
-
118
-
119
-
120
-
121
-
122
-
123
-
124
-
125
-
126
-
127
-
128
-
129
-
130
-
131
-
132
-
133
-
134
-
135
-
136
-
137
-
138
-
139
-
140
-
141
-
142
-
143
 |
 |

Table of Contents
of Micromania and the EB merger are reflected in the United States segment. See Note 17 of "Notes to Consolidated Financial Statements" for more
information.
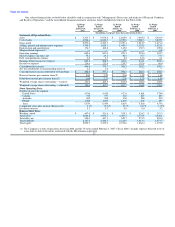
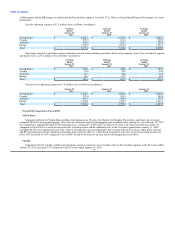
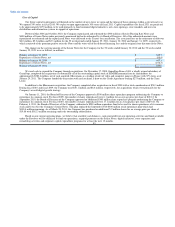
Sales by operating segment in U.S. dollars were as follows (in millions):
52 Weeks 52 Weeks 52 Weeks
Ended Ended Ended
January 29, January 30, January 31,
2011 2010 2009
United States $ 6,681.2 $ 6,275.0 $ 6,466.7
Canada 502.3 491.4 548.2
Australia 565.2 530.2 520.0
Europe 1,725.0 1,781.4 1,271.0
Total $ 9,473.7 $ 9,078.0 $ 8,805.9
Operating earnings by operating segment, defined as income from continuing operations before intercompany royalty fees, net interest expense
and income taxes, in U.S. dollars were as follows (in millions):
52 Weeks 52 Weeks 52 Weeks
Ended Ended Ended
January 29, January 30, January 31,
2011 2010 2009
United States $ 530.8 $ 488.8 $ 530.1
Canada 22.6 35.0 32.6
Australia 41.0 46.0 46.8
Europe 68.2 67.2 65.6
Total $ 662.6 $ 637.0 $ 675.1
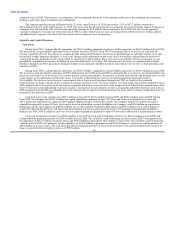
Total assets by operating segment in U.S. dollars were as follows (in millions):
January 29, January 30, January 31,
2011 2010 2009
United States $ 2,896.7 $ 2,864.9 $ 2,592.5
Canada 357.6 337.8 288.8
Australia 469.4 399.9 290.7
Europe 1,340.1 1,352.7 1,311.5
Total $ 5,063.8 $ 4,955.3 $ 4,483.5
Fiscal 2010 Compared to Fiscal 2009
United States
Segment results for the United States include retail operations in 50 states, the District of Columbia, Puerto Rico and Guam, the electronic
commerce Web site www.gamestop.com, Game Informer magazine and www.kongregate.com, an online video gaming site. As of January 29, 2011,
the United States segment included 4,536 GameStop stores, compared to 4,429 stores on January 30, 2010. Sales for fiscal 2010 increased 6.5%
compared to fiscal 2009 as a result of increased sales at existing stores and the additional sales at the 434 stores opened since January 31, 2009,
including the 227 stores opened in fiscal 2010. Sales at existing stores increased primarily due to strong sales of new release video game software
and PC entertainment software and increased market share, partially offset by a slow-down in hardware unit sales. Segment operating income for
fiscal 2010 increased by 8.6% compared to fiscal 2009, driven by the increase in sales and related margin discussed above.
Canada
Segment results for Canada include retail operations and an e-commerce site in Canada. Sales in the Canadian segment in the 52 weeks ended
January 29, 2011 increased 2.2% compared to the 52 weeks ended January 30, 2010.
37