GameStop 2010 Annual Report Download - page 104
Download and view the complete annual report
Please find page 104 of the 2010 GameStop annual report below. You can navigate through the pages in the report by either clicking on the pages listed below, or by using the keyword search tool below to find specific information within the annual report.-
 1
1 -
2
-
3
-
4
-
5
-
6
-
7
-
8
-
9
-
10
-
11
-
12
-
13
-
14
-
15
-
16
-
17
-
18
-
19
-
20
-
21
-
22
-
23
-
24
-
25
-
26
-
27
-
28
-
29
-
30
-
31
-
32
-
33
-
34
-
35
-
36
-
37
-
38
-
39
-
40
-
41
-
42
-
43
-
44
-
45
-
46
-
47
-
48
-
49
-
50
-
51
-
52
-
53
-
54
-
55
-
56
-
57
-
58
-
59
-
60
-
61
-
62
-
63
-
64
-
65
-
66
-
67
-
68
-
69
-
70
-
71
-
72
-
73
-
74
-
75
-
76
-
77
-
78
-
79
-
80
-
81
-
82
-
83
-
84
-
85
-
86
-
87
-
88
-
89
-
90
-
91
-
92
-
93
-
 94
94 -
 95
95 -
 96
96 -
 97
97 -
 98
98 -
 99
99 -
 100
100 -
 101
101 -
 102
102 -
 103
103 -
 104
104 -
 105
105 -
 106
106 -
 107
107 -
 108
108 -
 109
109 -
 110
110 -
 111
111 -
 112
112 -
 113
113 -
 114
114 -
115
-
116
-
117
-
118
-
119
-
120
-
121
-
122
-
123
-
124
-
125
-
126
-
127
-
128
-
129
-
130
-
131
-
132
-
133
-
134
-
135
-
136
-
137
-
138
-
139
-
140
-
141
-
142
-
143
 |
 |
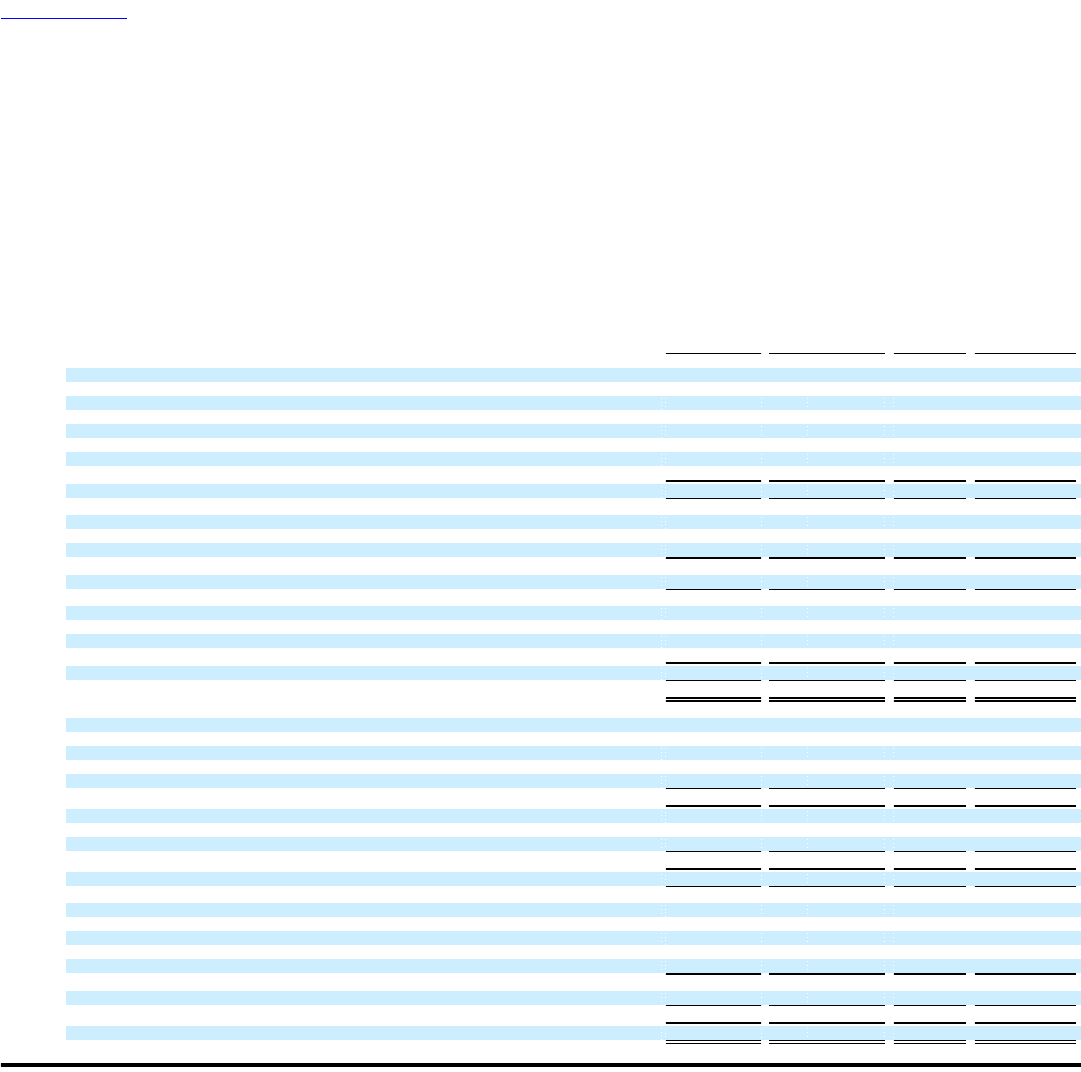
Table of Contents
GAMESTOP CORP.
NOTES TO CONSOLIDATED FINANCIAL STATEMENTS — (Continued)
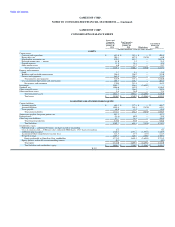
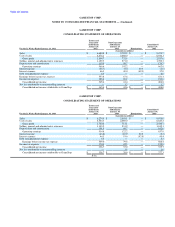
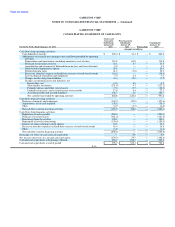
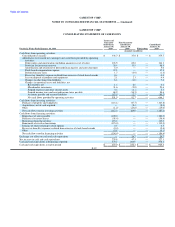
The following consolidating financial statements present the financial position as of January 29, 2011 and January 30, 2010 and results of
operations and cash flows for the fiscal years ended January 29, 2011, January 30, 2010 and January 31, 2009 of the Company's guarantor and non-
guarantor subsidiaries.
GAMESTOP CORP.
CONSOLIDATING BALANCE SHEET
Issuers and
Guarantor Non-Guarantor
Subsidiaries Subsidiaries Consolidated
January 29, January 29, January 29,
2011 2011 Eliminations 2011
(Amounts in millions, except per share amounts)
ASSETS:
Current assets:
Cash and cash equivalents $ 378.7 $ 332.1 $ — $ 710.8
Receivables, net 161.3 629.8 (725.6) 65.5
Merchandise inventories, net 783.4 474.1 — 1,257.5
Deferred income taxes — current 24.4 4.4 — 28.8
Prepaid expenses 40.5 35.2 — 75.7
Other current assets 10.1 6.4 — 16.5
Total current assets 1,398.4 1,482.0 (725.6) 2,154.8
Property and equipment:
Land 4.7 19.3 — 24.0
Buildings and leasehold improvements 323.3 253.9 — 577.2
Fixtures and equipment 663.9 153.9 — 817.8
Total property and equipment 991.9 427.1 — 1,419.0
Less accumulated depreciation and amortization 595.2 210.0 — 805.2
Net property and equipment 396.7 217.1 — 613.8
Investment 2,161.4 595.1 (2,756.5) —
Goodwill, net 1,125.1 871.2 — 1,996.3
Other intangible assets 11.4 243.2 — 254.6
Other noncurrent assets 10.8 33.5 — 44.3
Total noncurrent assets 3,705.4 1,960.1 (2,756.5) 2,909.0
Total assets $ 5,103.8 $ 3,442.1 $ (3,482.1) $ 5,063.8
LIABILITIES AND STOCKHOLDERS' EQUITY:
Current liabilities:
Accounts payable $ 725.7 $ 302.4 $ — $ 1,028.1
Accrued liabilities 1,047.7 334.9 (725.6) 657.0
Taxes payable 63.3 (0.6) — 62.7
Total current liabilities 1,836.7 636.7 (725.6) 1,747.8
Senior notes payable, long-term portion, net 249.0 — — 249.0
Deferred taxes 40.5 34.4 — 74.9
Other long-term liabilities 80.3 15.9 — 96.2
Total long-term liabilities 369.8 50.3 — 420.1
Total liabilities 2,206.5 687.0 (725.6) 2,167.9
Stockholders' equity:
Preferred stock — authorized 5.0 shares; no shares issued or outstanding — — — —
Class A common stock — $.001 par value; authorized 300.0 shares; 146.0 shares outstanding 0.1 — — 0.1
Additional paid-in-capital 928.9 2,430.7 (2,430.7) 928.9
Accumulated other comprehensive income (loss) 162.5 34.4 (34.4) 162.5
Retained earnings 1,805.8 291.4 (291.4) 1,805.8
Equity attributable to GameStop Corp. stockholders 2,897.3 2,756.5 (2,756.5) 2,897.3
Equity (deficit) attributable to noncontrolling interest — (1.4) — (1.4)
Total equity 2,897.3 2,755.1 (2,756.5) 2,895.9
Total liabilities and stockholders' equity $ 5,103.8 $ 3,442.1 $ (3,482.1) $ 5,063.8
F-34