GameStop 2010 Annual Report Download - page 108
Download and view the complete annual report
Please find page 108 of the 2010 GameStop annual report below. You can navigate through the pages in the report by either clicking on the pages listed below, or by using the keyword search tool below to find specific information within the annual report.-
 1
1 -
2
-
3
-
4
-
5
-
6
-
7
-
8
-
9
-
10
-
11
-
12
-
13
-
14
-
15
-
16
-
17
-
18
-
19
-
20
-
21
-
22
-
23
-
24
-
25
-
26
-
27
-
28
-
29
-
30
-
31
-
32
-
33
-
34
-
35
-
36
-
37
-
38
-
39
-
40
-
41
-
42
-
43
-
44
-
45
-
46
-
47
-
48
-
49
-
50
-
51
-
52
-
53
-
54
-
55
-
56
-
57
-
58
-
59
-
60
-
61
-
62
-
63
-
64
-
65
-
66
-
67
-
68
-
69
-
70
-
71
-
72
-
73
-
74
-
75
-
76
-
77
-
78
-
79
-
80
-
81
-
82
-
83
-
84
-
85
-
86
-
87
-
88
-
89
-
90
-
91
-
92
-
93
-
94
-
95
-
96
-
97
-
 98
98 -
 99
99 -
 100
100 -
 101
101 -
 102
102 -
 103
103 -
 104
104 -
 105
105 -
 106
106 -
 107
107 -
 108
108 -
 109
109 -
 110
110 -
 111
111 -
 112
112 -
 113
113 -
 114
114 -
 115
115 -
 116
116 -
 117
117 -
 118
118 -
119
-
120
-
121
-
122
-
123
-
124
-
125
-
126
-
127
-
128
-
129
-
130
-
131
-
132
-
133
-
134
-
135
-
136
-
137
-
138
-
139
-
140
-
141
-
142
-
143
 |
 |
Table of Contents
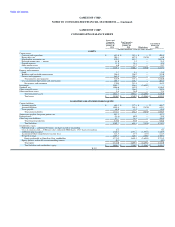
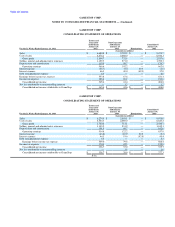
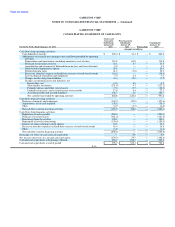
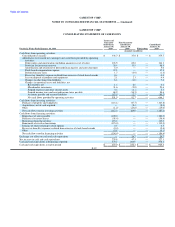
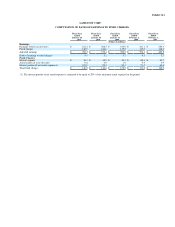
GAMESTOP CORP.
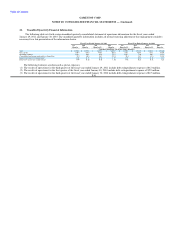
NOTES TO CONSOLIDATED FINANCIAL STATEMENTS — (Continued)
GAMESTOP CORP.
CONSOLIDATING STATEMENT OF CASH FLOWS
Issuers and
Guarantor Non-Guarantor
Subsidiaries Subsidiaries Consolidated
January 29, January 29, January 29,
For the 52 Weeks Ended January 29, 2011 2011 2011 Eliminations 2011
(Amounts in millions)
Cash flows from operating activities:
Consolidated net income $ 365.4 $ 41.4 $ — $ 406.8
Adjustments to reconcile net earnings to net cash flows provided by operating
activities:
Depreciation and amortization (including amounts in cost of sales) 116.8 60.0 — 176.8
Provision for inventory reserves 18.8 8.7 — 27.5
Amortization and retirement of deferred financing fees and issue discounts 5.0 — — 5.0
Stock-based compensation expense 29.6 — — 29.6
Deferred income taxes 41.8 (3.6) — 38.2
Excess tax (benefits) expense realized from exercise of stock-based awards (18.6) — — (18.6)
Loss on disposal of property and equipment 3.3 4.3 — 7.6
Changes in other long-term liabilities (6.4) (0.8) — (7.2)
Changes in operating assets and liabilities, net
Receivables, net (4.6) 4.8 — 0.2
Merchandise inventories (231.9) 4.7 — (227.2)
Prepaid expenses and other current assets (7.0) (3.5) — (10.5)
Prepaid income taxes and accrued income taxes payable 13.9 8.4 — 22.3
Accounts payable and accrued liabilities 138.7 2.0 — 140.7
Net cash flows provided by operating activities 464.8 126.4 — 591.2
Cash flows from investing activities:
Purchase of property and equipment (144.7) (52.9) — (197.6)
Acquisitions, net of cash acquired (38.1) — — (38.1)
Other (0.7) (3.7) — (4.4)
Net cash flows used in investing activities (183.5) (56.6) — (240.1)
Cash flows from financing activities:
Repurchase of notes payable (200.0) — — (200.0)
Purchase of treasury shares (381.2) — — (381.2)
Borrowings from the revolver 120.0 — — 120.0
Repayment of revolver borrowings (120.0) — — (120.0)
Issuance of shares relating to stock options 10.8 — — 10.8
Excess tax benefits (expense) realized from exercise of stock-based awards 18.6 — — 18.6
Other (3.8) — — (3.8)
Net cash flows used in financing activities (555.6) — — (555.6)
Exchange rate effect on cash and cash equivalents — 9.9 — 9.9
Net increase (decrease) in cash and cash equivalents (274.3) 79.7 — (194.6)
Cash and cash equivalents at beginning of period 653.0 252.4 — 905.4
Cash and cash equivalents at end of period $ 378.7 $ 332.1 $ — $ 710.8
F-38