GameStop 2010 Annual Report Download - page 24
Download and view the complete annual report
Please find page 24 of the 2010 GameStop annual report below. You can navigate through the pages in the report by either clicking on the pages listed below, or by using the keyword search tool below to find specific information within the annual report.-
 1
1 -
2
-
3
-
4
-
5
-
6
-
7
-
8
-
9
-
10
-
11
-
12
-
13
-
 14
14 -
 15
15 -
 16
16 -
 17
17 -
 18
18 -
 19
19 -
 20
20 -
 21
21 -
 22
22 -
 23
23 -
 24
24 -
 25
25 -
 26
26 -
 27
27 -
 28
28 -
 29
29 -
 30
30 -
 31
31 -
 32
32 -
 33
33 -
 34
34 -
35
-
36
-
37
-
38
-
39
-
40
-
41
-
42
-
43
-
44
-
45
-
46
-
47
-
48
-
49
-
50
-
51
-
52
-
53
-
54
-
55
-
56
-
57
-
58
-
59
-
60
-
61
-
62
-
63
-
64
-
65
-
66
-
67
-
68
-
69
-
70
-
71
-
72
-
73
-
74
-
75
-
76
-
77
-
78
-
79
-
80
-
81
-
82
-
83
-
84
-
85
-
86
-
87
-
88
-
89
-
90
-
91
-
92
-
93
-
94
-
95
-
96
-
97
-
98
-
99
-
100
-
101
-
102
-
103
-
104
-
105
-
106
-
107
-
108
-
109
-
110
-
111
-
112
-
113
-
114
-
115
-
116
-
117
-
118
-
119
-
120
-
121
-
122
-
123
-
124
-
125
-
126
-
127
-
128
-
129
-
130
-
131
-
132
-
133
-
134
-
135
-
136
-
137
-
138
-
139
-
140
-
141
-
142
-
143
 |
 |

Table of Contents
Operating Segments
We identified our four operating segments based on a combination of geographic areas, the methods with which we analyze performance and
how we divide management responsibility. Segment results for the United States include retail operations in the 50 states, the District of Columbia,
Guam and Puerto Rico, the electronic commerce Web site www.gamestop.com, Game Informer magazine, and the online video gaming Web sites
www.kongregate.com and www.joltonline.com. Segment results for Canada include retail and e-commerce operations in stores throughout Canada
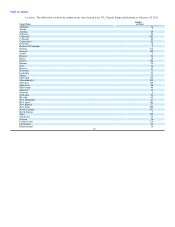
and segment results for Australia include retail and e-commerce operations in Australia and New Zealand. Segment results for Europe include retail
and e-commerce operations in 13 European countries.
Our U.S. segment is supported by distribution centers in Texas and Kentucky, and further supported by the use of third-party distribution
centers for new release titles. We distribute merchandise to our Canadian segment from distribution centers in Ontario. We have a distribution center
near Brisbane, Australia which supports our Australian operations and a small distribution facility in New Zealand which supports the stores in New
Zealand. European segment operations are supported by six regionally-located distribution centers.
All of our segments purchase products from many of the same vendors, including Sony Corporation ("Sony") and Electronic Arts. Products
from certain other vendors such as Microsoft and Nintendo are obtained either directly from the manufacturer or publisher or through distributors
depending upon the particular market in which we operate.
Additional information, including financial information, regarding our operating segments can be found in "Management's Discussion and
Analysis of Financial Condition and Results of Operations" elsewhere in this Annual Report on Form 10-K and in Note 17 of "Notes to
Consolidated Financial Statements."
Merchandise
Substantially all of our revenues are derived from the sale of tangible products; however, we also sell downloadable software and subscription,
time and points cards which do not involve physical product. Our product offerings consist of new and used video game products, PC entertainment
software, and related products, such as video game accessories and strategy guides. Our in-store inventory generally consists of a constantly
changing selection of over 4,500 SKUs. We have buying groups in each of our segments that negotiate terms, discounts and cooperative advertising
allowances for the stores in their respective geographic areas. We use customer requests and feedback, advance orders, industry magazines and
product reviews to determine which new releases are expected to be hits. Advance orders are tracked at individual stores to distribute titles and
capture demand effectively. This merchandise management is essential because a significant portion of a game's sales are usually generated in the
first days and weeks following its release.
Video Game Hardware. We offer the video game platforms of all major manufacturers, including the Sony PlayStation 2 and 3 and PSP,
Microsoft Xbox 360 and Kinect, the Nintendo DSi, DSi XL and Wii. We also offer extended service agreements on video game hardware and
software. In support of our strategy to be the destination location for electronic game players, we aggressively promote the sale of video game
platforms. Video game hardware sales are generally driven by the introduction of new platform technology and the reduction in price points as
platforms mature. Due to our strong relationships with the manufacturers of these platforms, we often receive disproportionately large allocations of
new release hardware products, which is an important component of our strategy to be the destination of choice for electronic game players. We
believe that selling video game hardware increases store traffic and promotes customer loyalty, leading to increased sales of video game software
and accessories, which have higher gross margins than video game hardware.
Video Game Software. We purchase new video game software from the leading manufacturers, including Sony, Nintendo and Microsoft, as
well as over 50 third-party game publishers, such as Electronic Arts and Activision. We are one of the largest customers of video game titles sold by
these publishers. We generally carry over 1,000 SKUs of new video game software at any given time across a variety of genres, including Sports,
Action, Strategy, Adventure/Role Playing and Simulation. In 2010, we began selling digitally downloadable add-on content developed by publishers
for existing games. 8