GameStop 2010 Annual Report Download - page 51
Download and view the complete annual report
Please find page 51 of the 2010 GameStop annual report below. You can navigate through the pages in the report by either clicking on the pages listed below, or by using the keyword search tool below to find specific information within the annual report.-
 1
1 -
2
-
3
-
4
-
5
-
6
-
7
-
8
-
9
-
10
-
11
-
12
-
13
-
14
-
15
-
16
-
17
-
18
-
19
-
20
-
21
-
22
-
23
-
24
-
25
-
26
-
27
-
28
-
29
-
30
-
31
-
32
-
33
-
34
-
35
-
36
-
37
-
38
-
39
-
40
-
 41
41 -
 42
42 -
 43
43 -
 44
44 -
 45
45 -
 46
46 -
 47
47 -
 48
48 -
 49
49 -
 50
50 -
 51
51 -
 52
52 -
 53
53 -
 54
54 -
 55
55 -
 56
56 -
 57
57 -
 58
58 -
 59
59 -
 60
60 -
 61
61 -
62
-
63
-
64
-
65
-
66
-
67
-
68
-
69
-
70
-
71
-
72
-
73
-
74
-
75
-
76
-
77
-
78
-
79
-
80
-
81
-
82
-
83
-
84
-
85
-
86
-
87
-
88
-
89
-
90
-
91
-
92
-
93
-
94
-
95
-
96
-
97
-
98
-
99
-
100
-
101
-
102
-
103
-
104
-
105
-
106
-
107
-
108
-
109
-
110
-
111
-
112
-
113
-
114
-
115
-
116
-
117
-
118
-
119
-
120
-
121
-
122
-
123
-
124
-
125
-
126
-
127
-
128
-
129
-
130
-
131
-
132
-
133
-
134
-
135
-
136
-
137
-
138
-
139
-
140
-
141
-
142
-
143
 |
 |

Table of Contents
Income tax expense increased by $1.8 million, from $212.8 million in fiscal 2009 to $214.6 million in fiscal 2010. The Company's effective
tax rate decreased from 36.2% in fiscal 2009 to 34.5% in fiscal 2010 due primarily to the variability in the accounting for the Company's uncertain
tax positions. See Note 12 of "Notes to Consolidated Financial Statements" for additional information regarding income taxes.
The factors described above led to an increase in operating earnings of $25.6 million, or 4.0%, from $637.0 million in fiscal 2009 to
$662.6 million in fiscal 2010 and an increase in consolidated net income of $31.1 million, or 8.3%, from $375.7 million in fiscal 2009 to
$406.8 million in fiscal 2010.
In 2009, the Financial Accounting Standards Board ("FASB") issued new guidance related to the reporting of non-controlling interests in
subsidiaries. The $1.2 million and $1.6 million increase in consolidated net income attributable to GameStop shareholders for fiscal 2010 and fiscal
2009, respectively, represents the portion of the net loss of the Company's non-wholly owned subsidiaries attributable to the minority shareholders'
interest.
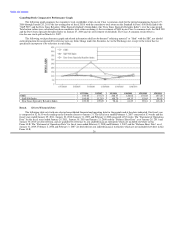
Fiscal 2009 Compared to Fiscal 2008
Sales increased $272.1 million, or 3.1%, to $9,078.0 million in the 52 weeks of fiscal 2009 compared to $8,805.9 million in the 52 weeks of
fiscal 2008. The increase in sales was attributable to the addition of non-comparable store sales from the 1,062 stores opened since February 2, 2008,
combined with the additional sales from the Micromania acquisition for an approximate total of $896 million and increases related to changes in
foreign exchange rates of $25.9 million, offset by a decrease in comparable store sales of 7.9%. The decrease in comparable store sales was due
primarily to a decrease in consumer traffic worldwide as a result of the continued macroeconomic weakness and a slow-down in hardware unit sell-
through.
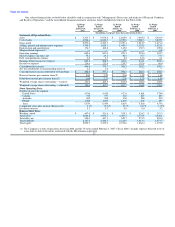
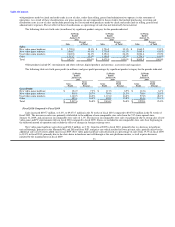
New video game hardware sales decreased $103.7 million, or 5.6%, from fiscal 2008 to fiscal 2009, primarily due to a decrease in consumer
traffic as discussed above and price cuts on hardware consoles, partially offset by the additional sales at new stores added since the prior year
through growth and acquisition. New video game hardware sales decreased as a percentage of sales from 21.1% in fiscal 2008 to 19.3% in fiscal
2009, primarily due to the slow-down in hardware unit sell-through as the new platforms mature, as well as price decreases initiated by the
manufacturers in fiscal 2009.
New video game software sales increased $45.9 million, or 1.2%, from fiscal 2008 to fiscal 2009, primarily due to the addition of sales at the
new and acquired stores added since fiscal 2008. New video game software sales decreased as a percentage of total sales from 41.9% in fiscal 2008
to 41.1% in fiscal 2009, primarily due to the 18% growth in used video game product sales as discussed below.
Used video game product sales increased $367.5 million, or 18.1%, from fiscal 2008 to fiscal 2009, primarily due to an increase in the
availability of hardware and software associated with the current generation hardware platforms as those platforms age and expand, the strong
growth of used video game product sales internationally, as well as the addition of sales at the new and acquired stores added since fiscal 2008. As a
percentage of sales, used video game product sales increased from 23.0% to 26.4%, primarily due to the continued expansion of the installed base of
new video game consoles and the availability of used hardware and software from those consoles. Sales of other product categories, including PC
entertainment and other software and accessories, decreased 3.0%, or $37.6 million, from fiscal 2008 to fiscal 2009, primarily due to stronger sales
of newly released PC entertainment software titles in fiscal 2008.
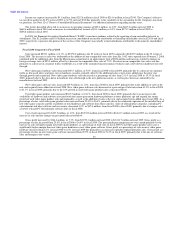
Cost of sales increased by $107.5 million, or 1.6%, from $6,535.8 million in fiscal 2008 to $6,643.3 million in fiscal 2009 as a result of the
increase in sales and the changes in gross profit discussed below.
Gross profit increased by $164.6 million, or 7.3%, from $2,270.1 million in fiscal 2008 to $2,434.7 million in fiscal 2009. Gross profit as a
percentage of sales increased from 25.8% in fiscal 2008 to 26.8% in fiscal 2009. The gross profit percentage increase was caused primarily by the
increase in sales of higher margin used video game products as a percentage of total sales in fiscal 2009. Used video game product sales carry a
significantly higher margin than new video game hardware or new video game software. Gross profit as a percentage of sales on new video game
hardware increased from 6.1% in fiscal 2008 to 6.5% in fiscal 2009 due primarily to an increase in product replacement plan sales. Gross profit as a
percentage of sales on new video game software increased from 20.9% in fiscal 2008 to 21.3% in fiscal 2009, primarily due to the mix of software
sales and margin in the various 35