GameStop 2010 Annual Report Download - page 101
Download and view the complete annual report
Please find page 101 of the 2010 GameStop annual report below. You can navigate through the pages in the report by either clicking on the pages listed below, or by using the keyword search tool below to find specific information within the annual report.-
 1
1 -
2
-
3
-
4
-
5
-
6
-
7
-
8
-
9
-
10
-
11
-
12
-
13
-
14
-
15
-
16
-
17
-
18
-
19
-
20
-
21
-
22
-
23
-
24
-
25
-
26
-
27
-
28
-
29
-
30
-
31
-
32
-
33
-
34
-
35
-
36
-
37
-
38
-
39
-
40
-
41
-
42
-
43
-
44
-
45
-
46
-
47
-
48
-
49
-
50
-
51
-
52
-
53
-
54
-
55
-
56
-
57
-
58
-
59
-
60
-
61
-
62
-
63
-
64
-
65
-
66
-
67
-
68
-
69
-
70
-
71
-
72
-
73
-
74
-
75
-
76
-
77
-
78
-
79
-
80
-
81
-
82
-
83
-
84
-
85
-
86
-
87
-
88
-
89
-
90
-
 91
91 -
 92
92 -
 93
93 -
 94
94 -
 95
95 -
 96
96 -
 97
97 -
 98
98 -
 99
99 -
 100
100 -
 101
101 -
 102
102 -
 103
103 -
 104
104 -
 105
105 -
 106
106 -
 107
107 -
 108
108 -
 109
109 -
 110
110 -
 111
111 -
112
-
113
-
114
-
115
-
116
-
117
-
118
-
119
-
120
-
121
-
122
-
123
-
124
-
125
-
126
-
127
-
128
-
129
-
130
-
131
-
132
-
133
-
134
-
135
-
136
-
137
-
138
-
139
-
140
-
141
-
142
-
143
 |
 |

Table of Contents
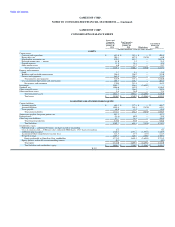
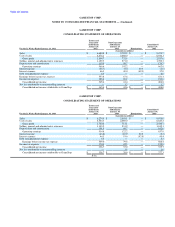
GAMESTOP CORP.
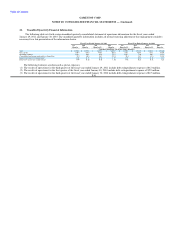
NOTES TO CONSOLIDATED FINANCIAL STATEMENTS — (Continued)
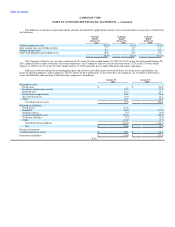
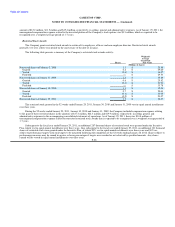
United
Fiscal Year Ended January 30, 2010 States Canada Australia Europe Other Consolidated
Sales $ 6,275.0 $ 491.4 $ 530.2 $ 1,781.4 $ — $ 9,078.0
Depreciation and amortization 102.1 7.4 9.4 43.7 — 162.6
Operating earnings 488.8 35.0 46.0 67.2 — 637.0
Interest income (51.5) — (1.7) (1.4) 52.4 (2.2)
Interest expense 44.2 — 0.1 53.5 (52.4) 45.4
Earnings before income tax expense 490.8 35.0 47.5 15.2 — 588.5
Income tax expense 162.5 11.3 14.2 24.8 — 212.8
Goodwill 1,100.2 128.6 174.1 543.6 — 1,946.5
Other long-lived assets 384.1 29.4 33.6 434.4 — 881.5
Total assets 2,864.9 337.8 399.9 1,352.7 — 4,955.3
United
Fiscal Year Ended January 31, 2009 States Canada Australia Europe Other Consolidated
Sales $ 6,466.7 $ 548.2 $ 520.0 $ 1,271.0 $ — $ 8,805.9
Depreciation and amortization 103.6 8.1 9.7 23.6 — 145.0
Operating earnings 530.1 32.6 46.8 65.6 — 675.1
Interest income (30.0) (0.9) (3.1) (20.0) 42.4 (11.6)
Interest expense 49.8 — 0.2 42.8 (42.4) 50.4
Earnings before income tax expense 534.4 22.4 39.9 37.3 — 634.0
Income tax expense 197.1 7.5 12.3 18.8 — 235.7
Goodwill 1,096.6 112.0 125.6 498.8 — 1,833.0
Other long-lived assets 377.8 28.4 24.6 401.6 — 832.4
Total assets 2,592.5 288.8 290.7 1,311.5 — 4,483.5
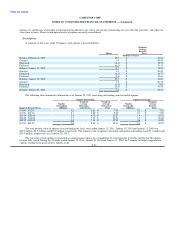
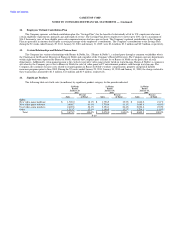
18. Supplemental Cash Flow Information
52 Weeks 52 Weeks 52 Weeks
Ended Ended Ended
January 29, January 30, January 31,
2011 2010 2009
(In millions)
Cash paid during the period for:
Interest $ 36.9 $ 44.1 $ 45.3
Income taxes 171.1 153.1 204.8
Subsidiaries acquired:
Goodwill 28.5 4.2 459.3
Cash received in acquisition — — 45.7
Noncontrolling interests — 4.7 —
Net assets acquired (or liabilities assumed) 9.6 (0.5) 171.4
Cash paid for subsidiaries $ 38.1 $ 8.4 $ 676.4
Other non-cash financing activities:
Treasury stock repurchases settled after the fiscal year ends $ 22.0 $ 64.6 $ —
F-31