GameStop 2010 Annual Report Download - page 43
Download and view the complete annual report
Please find page 43 of the 2010 GameStop annual report below. You can navigate through the pages in the report by either clicking on the pages listed below, or by using the keyword search tool below to find specific information within the annual report.-
 1
1 -
2
-
3
-
4
-
5
-
6
-
7
-
8
-
9
-
10
-
11
-
12
-
13
-
14
-
15
-
16
-
17
-
18
-
19
-
20
-
21
-
22
-
23
-
24
-
25
-
26
-
27
-
28
-
29
-
30
-
31
-
32
-
 33
33 -
 34
34 -
 35
35 -
 36
36 -
 37
37 -
 38
38 -
 39
39 -
 40
40 -
 41
41 -
 42
42 -
 43
43 -
 44
44 -
 45
45 -
 46
46 -
 47
47 -
 48
48 -
 49
49 -
 50
50 -
 51
51 -
 52
52 -
 53
53 -
54
-
55
-
56
-
57
-
58
-
59
-
60
-
61
-
62
-
63
-
64
-
65
-
66
-
67
-
68
-
69
-
70
-
71
-
72
-
73
-
74
-
75
-
76
-
77
-
78
-
79
-
80
-
81
-
82
-
83
-
84
-
85
-
86
-
87
-
88
-
89
-
90
-
91
-
92
-
93
-
94
-
95
-
96
-
97
-
98
-
99
-
100
-
101
-
102
-
103
-
104
-
105
-
106
-
107
-
108
-
109
-
110
-
111
-
112
-
113
-
114
-
115
-
116
-
117
-
118
-
119
-
120
-
121
-
122
-
123
-
124
-
125
-
126
-
127
-
128
-
129
-
130
-
131
-
132
-
133
-
134
-
135
-
136
-
137
-
138
-
139
-
140
-
141
-
142
-
143
 |
 |
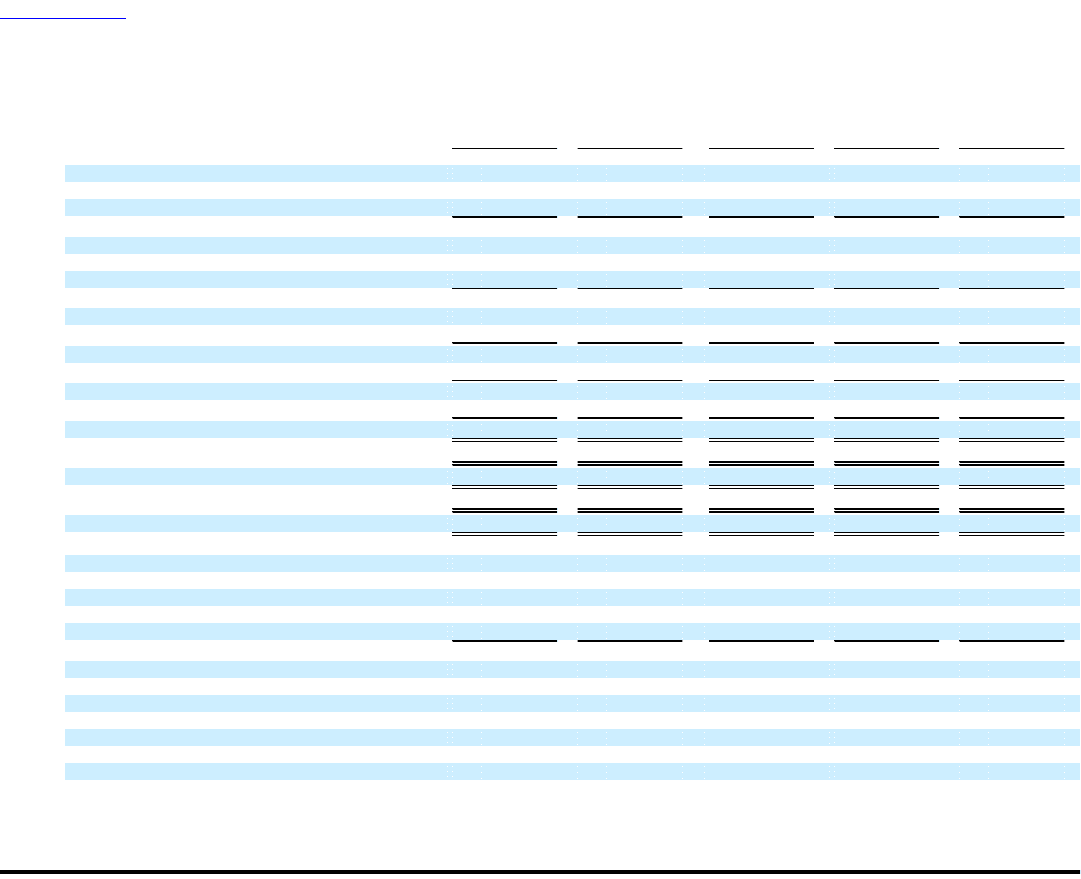
Table of Contents
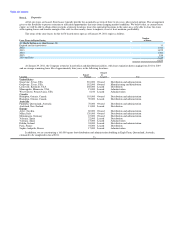
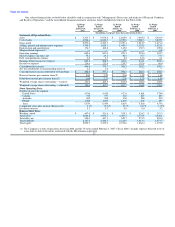
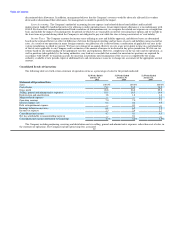
Our selected financial data set forth below should be read in conjunction with "Management's Discussion and Analysis of Financial Condition
and Results of Operations" and the consolidated financial statements and notes thereto included elsewhere in this Form 10-K.
52 Weeks 52 Weeks 52 Weeks 52 Weeks 53 Weeks
Ended Ended Ended Ended Ended
January 29, January 30, January 31, February 2, February 3,
2011 2010 2009 2008 2007
(In millions, except per share data and statistical data)
Statement of Operations Data:
Sales $ 9,473.7 $ 9,078.0 $ 8,805.9 $ 7,094.0 $ 5,318.9
Cost of sales 6,936.1 6,643.3 6,535.8 5,280.3 3,847.5
Gross profit 2,537.6 2,434.7 2,270.1 1,813.7 1,471.4
Selling, general and administrative expenses 1,700.3 1,635.1 1,445.4 1,182.0 1,021.1
Depreciation and amortization 174.7 162.6 145.0 130.3 109.8
Merger-related expenses(1) — — 4.6 — 6.8
Operating earnings 662.6 637.0 675.1 501.4 333.7
Interest expense (income), net 35.2 43.2 38.8 47.7 73.3
Debt extinguishment expense 6.0 5.3 2.3 12.6 6.1
Earnings before income tax expense 621.4 588.5 634.0 441.1 254.3
Income tax expense 214.6 212.8 235.7 152.8 96.0
Consolidated net income 406.8 375.7 398.3 288.3 158.3
Net loss attributable to noncontrolling interests 1.2 1.6 — — —
Consolidated net income attributable to GameStop $ 408.0 $ 377.3 $ 398.3 $ 288.3 $ 158.3
Basic net income per common share(2) $ 2.69 $ 2.29 $ 2.44 $ 1.82 $ 1.06
Diluted net income per common share(2) $ 2.65 $ 2.25 $ 2.38 $ 1.75 $ 1.00
Weighted average shares outstanding — basic(2) 151.6 164.5 163.2 158.2 149.9
Weighted average shares outstanding — diluted(2) 154.0 167.9 167.7 164.8 158.3
Store Operating Data:
Number of stores by segment
United States 4,536 4,429 4,331 4,061 3,799
Canada 345 337 325 287 267
Australia 405 388 350 280 219
Europe 1,384 1,296 1,201 636 493
Total 6,670 6,450 6,207 5,264 4,778
Comparable store sales increase (decrease)(3) 1.1% (7.9)% 12.3% 24.7% 11.9%
Inventory turnover 5.1 5.2 5.8 6.0 5.2
Balance Sheet Data:
Working capital $ 407.0 $ 471.6 $ 255.3 $ 534.2 $ 353.3
Total assets 5,063.8 4,955.3 4,483.5 3,775.9 3,349.6
Total debt, net 249.0 447.3 545.7 574.5 855.5
Total liabilities 2,167.9 2,232.3 2,212.9 1,913.4 1,973.7
Total equity 2,895.9 2,723.0 2,270.6 1,862.4 1,375.9
(1) The Company's results of operations for fiscal 2008 and the 53 weeks ended February 3, 2007 ("fiscal 2006") include expenses believed to be of
a one-time or short-term nature associated with the Micromania acquisition
27