GameStop 2010 Annual Report Download - page 83
Download and view the complete annual report
Please find page 83 of the 2010 GameStop annual report below. You can navigate through the pages in the report by either clicking on the pages listed below, or by using the keyword search tool below to find specific information within the annual report.-
 1
1 -
2
-
3
-
4
-
5
-
6
-
7
-
8
-
9
-
10
-
11
-
12
-
13
-
14
-
15
-
16
-
17
-
18
-
19
-
20
-
21
-
22
-
23
-
24
-
25
-
26
-
27
-
28
-
29
-
30
-
31
-
32
-
33
-
34
-
35
-
36
-
37
-
38
-
39
-
40
-
41
-
42
-
43
-
44
-
45
-
46
-
47
-
48
-
49
-
50
-
51
-
52
-
53
-
54
-
55
-
56
-
57
-
58
-
59
-
60
-
61
-
62
-
63
-
64
-
65
-
66
-
67
-
68
-
69
-
70
-
71
-
72
-
 73
73 -
 74
74 -
 75
75 -
 76
76 -
 77
77 -
 78
78 -
 79
79 -
 80
80 -
 81
81 -
 82
82 -
 83
83 -
 84
84 -
 85
85 -
 86
86 -
 87
87 -
 88
88 -
 89
89 -
 90
90 -
 91
91 -
 92
92 -
 93
93 -
94
-
95
-
96
-
97
-
98
-
99
-
100
-
101
-
102
-
103
-
104
-
105
-
106
-
107
-
108
-
109
-
110
-
111
-
112
-
113
-
114
-
115
-
116
-
117
-
118
-
119
-
120
-
121
-
122
-
123
-
124
-
125
-
126
-
127
-
128
-
129
-
130
-
131
-
132
-
133
-
134
-
135
-
136
-
137
-
138
-
139
-
140
-
141
-
142
-
143
 |
 |

Table of Contents
GAMESTOP CORP.
NOTES TO CONSOLIDATED FINANCIAL STATEMENTS — (Continued)
Net Income Per Common Share
Basic net income per common share is computed by dividing the net income available to common stockholders by the weighted average
number of common shares outstanding during the period. Diluted net income per common share is computed by dividing the net income available to
common stockholders by the weighted average number of common shares outstanding and potentially dilutive securities outstanding during the
period. Potentially dilutive securities include stock options and unvested restricted stock outstanding during the period, using the treasury stock
method. Potentially dilutive securities are excluded from the computations of diluted earnings per share if their effect would be antidilutive. Note 4
provides additional information regarding net earnings per common share.
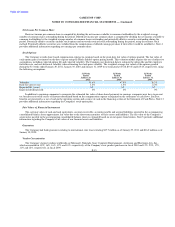
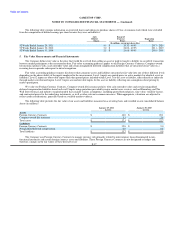
Stock Options
The Company records share-based compensation expense in earnings based on the grant-date fair value of options granted. The fair value of
each option grant is estimated on the date of grant using the Black-Scholes option pricing model. This valuation model requires the use of subjective
assumptions, including expected option life and expected volatility. The Company uses historical data to estimate the option life and the employee
forfeiture rate, and uses historical volatility when estimating the stock price volatility. The weighted-average fair values of the options granted
during the 52 weeks ended January 29, 2011, January 30, 2010 and January 31, 2009 were estimated at $7.88, $9.45 and $15.45, respectively, using
the following assumptions:
52 Weeks 52 Weeks 52 Weeks
Ended Ended Ended
January 29, January 30, January 31,
2011 2010 2009
Volatility 51.6% 47.9% 38.2%
Risk-free interest rate 1.6% 1.5% 2.4%
Expected life (years) 3.5 3.5 3.5
Expected dividend yield 0% 0% 0%
In addition to requiring companies to recognize the estimated fair value of share-based payments in earnings, companies now have to present
tax benefits received in excess of amounts determined based on the compensation expense recognized on the statements of cash flows. Such tax
benefits are presented as a use of cash in the operating section and a source of cash in the financing section of the Statement of Cash Flows. Note 13
provides additional information regarding the Company's stock option plan.
Fair Values of Financial Instruments
The carrying values of cash and cash equivalents, accounts receivable, accounts payable and accrued liabilities reported in the accompanying
consolidated balance sheets approximate fair value due to the short-term maturities of these assets and liabilities. The fair value of the Company's
senior notes payable in the accompanying consolidated balance sheets is estimated based on recent quotes from brokers. Note 5 provides additional
information regarding the Company's fair values of our financial assets and liabilities.
Guarantees
The Company had bank guarantees relating to international store leases totaling $17.7 million as of January 29, 2011 and $16.0 million as of
January 30, 2010.
Vendor Concentration
The Company's largest vendors worldwide are Microsoft, Nintendo, Sony Computer Entertainment, Activision and Electronic Arts, Inc.,
which accounted for 18%, 16%, 16%, 12% and 10%, respectively, of the Company's new product purchases in fiscal 2010 and 12%, 23%, 17%,
11% and 12%, respectively, in fiscal 2009. F-13