GameStop 2010 Annual Report Download - page 49
Download and view the complete annual report
Please find page 49 of the 2010 GameStop annual report below. You can navigate through the pages in the report by either clicking on the pages listed below, or by using the keyword search tool below to find specific information within the annual report.-
 1
1 -
2
-
3
-
4
-
5
-
6
-
7
-
8
-
9
-
10
-
11
-
12
-
13
-
14
-
15
-
16
-
17
-
18
-
19
-
20
-
21
-
22
-
23
-
24
-
25
-
26
-
27
-
28
-
29
-
30
-
31
-
32
-
33
-
34
-
35
-
36
-
37
-
38
-
 39
39 -
 40
40 -
 41
41 -
 42
42 -
 43
43 -
 44
44 -
 45
45 -
 46
46 -
 47
47 -
 48
48 -
 49
49 -
 50
50 -
 51
51 -
 52
52 -
 53
53 -
 54
54 -
 55
55 -
 56
56 -
 57
57 -
 58
58 -
 59
59 -
60
-
61
-
62
-
63
-
64
-
65
-
66
-
67
-
68
-
69
-
70
-
71
-
72
-
73
-
74
-
75
-
76
-
77
-
78
-
79
-
80
-
81
-
82
-
83
-
84
-
85
-
86
-
87
-
88
-
89
-
90
-
91
-
92
-
93
-
94
-
95
-
96
-
97
-
98
-
99
-
100
-
101
-
102
-
103
-
104
-
105
-
106
-
107
-
108
-
109
-
110
-
111
-
112
-
113
-
114
-
115
-
116
-
117
-
118
-
119
-
120
-
121
-
122
-
123
-
124
-
125
-
126
-
127
-
128
-
129
-
130
-
131
-
132
-
133
-
134
-
135
-
136
-
137
-
138
-
139
-
140
-
141
-
142
-
143
 |
 |

Table of Contents
with purchases made by check and credit cards in cost of sales, rather than selling, general and administrative expenses, in the statement of
operations. As a result of these classifications, our gross margins are not comparable to those retailers that include purchasing, receiving and
distribution costs in cost of sales and include processing fees associated with purchases made by check and credit cards in selling, general and
administrative expenses. The net effect of these classifications as a percentage of sales has not historically been material.
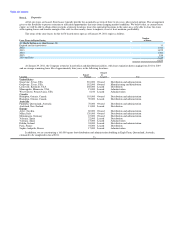
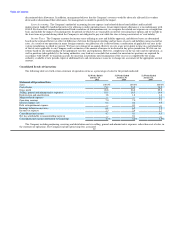
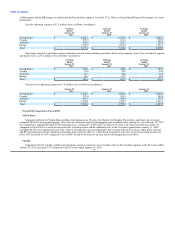
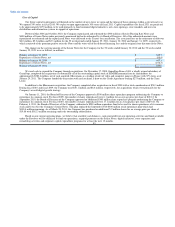
The following table sets forth sales (in millions) by significant product category for the periods indicated:
52 Weeks 52 Weeks 52 Weeks
Ended Ended Ended
January 29, January 30, January 31,
2011 2010 2009
Percent Percent Percent
Sales of Total Sales of Total Sales of Total
Sales:
New video game hardware $ 1,720.0 18.1% $ 1,756.5 19.3% $ 1,860.2 21.1%
New video game software 3,968.7 41.9% 3,730.9 41.1% 3,685.0 41.9%
Used video game products 2,469.8 26.1% 2,394.1 26.4% 2,026.6 23.0%
Other 1,315.2 13.9% 1,196.5 13.2% 1,234.1 14.0%
Total $ 9,473.7 100.0% $ 9,078.0 100.0% $ 8,805.9 100.0%
Other products include PC entertainment and other software, digital products and currency, accessories and magazines.
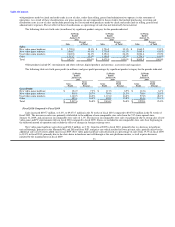
The following table sets forth gross profit (in millions) and gross profit percentages by significant product category for the periods indicated:
52 Weeks 52 Weeks 52 Weeks
Ended Ended Ended
January 29, January 30, January 31,
2011 2010 2009
Gross Gross Gross
Gross Profit Gross Profit Gross Profit
Profit Percent Profit Percent Profit Percent
Gross Profit:
New video game hardware $ 124.9 7.3% $ 113.5 6.5% $ 112.6 6.1%
New video game software 819.6 20.7% 795.0 21.3% 768.4 20.9%
Used video game products 1,140.5 46.2% 1,121.2 46.8% 974.5 48.1%
Other 452.6 34.4% 405.0 33.8% 414.6 33.6%
Total $ 2,537.6 26.8% $ 2,434.7 26.8% $ 2,270.1 25.8%
Fiscal 2010 Compared to Fiscal 2009
Sales increased $395.7 million, or 4.4%, to $9,473.7 million in the 52 weeks of fiscal 2010 compared to $9,078.0 million in the 52 weeks of
fiscal 2009. The increase in sales was primarily attributable to the addition of non-comparable store sales from the 747 stores opened since
January 31, 2009, and an increase in comparable store sales of 1.1%. The increase in comparable store sales was primarily due to strong sales of new
video game and PC entertainment titles in fiscal 2010 compared to fiscal 2009. Stores are included in our comparable store sales base beginning in
the thirteenth month of operation and exclude the effect of changes in foreign exchange rates.
New video game hardware sales decreased $36.5 million, or 2.1%, from fiscal 2009 to fiscal 2010, primarily due to a decrease in hardware
unit sell-through, primarily in the Nintendo Wii and DSi and Sony PSP, and price cuts which resulted in lower per unit sales, partially offset by the
additional sales at new stores added since fiscal 2009. New video game hardware sales decreased as a percentage of sales from 19.3% in fiscal 2009
to 18.1% in fiscal 2010, primarily due to the slow-down in hardware unit sell-through as the new platforms mature, as well as price decreases
initiated by the manufacturers in fiscal 2009. 33