GameStop 2010 Annual Report Download - page 55
Download and view the complete annual report
Please find page 55 of the 2010 GameStop annual report below. You can navigate through the pages in the report by either clicking on the pages listed below, or by using the keyword search tool below to find specific information within the annual report.-
 1
1 -
2
-
3
-
4
-
5
-
6
-
7
-
8
-
9
-
10
-
11
-
12
-
13
-
14
-
15
-
16
-
17
-
18
-
19
-
20
-
21
-
22
-
23
-
24
-
25
-
26
-
27
-
28
-
29
-
30
-
31
-
32
-
33
-
34
-
35
-
36
-
37
-
38
-
39
-
40
-
41
-
42
-
43
-
44
-
 45
45 -
 46
46 -
 47
47 -
 48
48 -
 49
49 -
 50
50 -
 51
51 -
 52
52 -
 53
53 -
 54
54 -
 55
55 -
 56
56 -
 57
57 -
 58
58 -
 59
59 -
 60
60 -
 61
61 -
 62
62 -
 63
63 -
 64
64 -
 65
65 -
66
-
67
-
68
-
69
-
70
-
71
-
72
-
73
-
74
-
75
-
76
-
77
-
78
-
79
-
80
-
81
-
82
-
83
-
84
-
85
-
86
-
87
-
88
-
89
-
90
-
91
-
92
-
93
-
94
-
95
-
96
-
97
-
98
-
99
-
100
-
101
-
102
-
103
-
104
-
105
-
106
-
107
-
108
-
109
-
110
-
111
-
112
-
113
-
114
-
115
-
116
-
117
-
118
-
119
-
120
-
121
-
122
-
123
-
124
-
125
-
126
-
127
-
128
-
129
-
130
-
131
-
132
-
133
-
134
-
135
-
136
-
137
-
138
-
139
-
140
-
141
-
142
-
143
 |
 |

Table of Contents
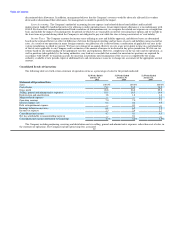
Fiscal 2009 Compared to Fiscal 2008
United States
As of January 30, 2010, the United States segment included 4,429 GameStop stores, compared to 4,331 stores on January 31, 2009. Sales for
the 52 weeks ended January 30, 2010 decreased 3.0% compared to the 52 weeks ended January 31, 2009 as a result of decreased sales at existing
stores offset by the opening of 514 new stores, including 207 stores in the 52 weeks ended January 30, 2010. Sales at existing stores decreased
partially due to a decrease in consumer traffic as a result of the continued macroeconomic weakness and a slow-down in hardware units sales, offset
by an increase in used video game product sales due to an increase in the availability of hardware and software associated with the current
generation of hardware platforms as those platforms age and expand. Segment operating income for the 52 weeks ended January 30, 2010 decreased
by 7.8% compared to the 52 weeks ended January 31, 2009, driven by the decrease in sales and the deleveraging of the fixed components of selling,
general and administrative expenses.
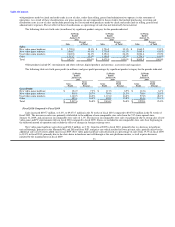
Canada
Sales in the Canadian segment in the 52 weeks ended January 30, 2010 decreased 10.4% compared to the 52 weeks ended January 31, 2009.
The decrease in sales was primarily attributable to decreased sales at existing stores offset by the additional sales at the 47 stores opened during
fiscal 2008 and fiscal 2009. As of January 30, 2010, the Canadian segment had 337 stores compared to 325 stores as of January 31, 2009. The
decrease in sales at existing stores was primarily due to weak consumer traffic and a slow-down in hardware unit sell-through. Segment operating
income for the 52 weeks ended January 30, 2010 increased by 7.4% to $35.0 million compared to the 52 weeks ended January 31, 2009. The
increase in operating income when compared to the prior year was primarily due to an increase in gross margin, driven by an increase in used
product sales and the favorable impact of changes in exchange rates which had the effect of increasing operating earnings by $1.2 million when
compared to fiscal 2008.
Australia
As of January 30, 2010, the Australian segment included 388 stores, compared to 350 stores as of January 31, 2009. Sales for the 52 weeks
ended January 30, 2010 increased 2.0% compared to the 52 weeks ended January 31, 2009. The increase in sales was due to the additional sales at
the 112 stores opened during fiscal 2008 and fiscal 2009 and the favorable impact of changes in exchange rates, which had the effect of increasing
sales by $5.2 million, offset by a decrease in sales at existing stores. The decrease in sales at existing stores was primarily due to weak consumer
traffic and a slow-down in hardware unit sell-through. Segment operating income in the 52 weeks ended January 30, 2010 decreased by 1.7% to
$46.0 million when compared to the 52 weeks ended January 31, 2009. The decrease in operating earnings for the 52 weeks ended January 30, 2010
was due to the decrease in sales at existing stores and the increase in selling, general and administrative expenses associated with the increase in the
number of stores in operation. Selling, general and administrative expenses will rise as a percentage of sales during periods of store count growth
due to the fixed nature of many store expenses compared to the immature sales at new stores. This decrease in operating earnings was offset by the
favorable impact of changes in exchange rates which had the effect of increasing operating earnings by $3.6 million when compared to fiscal 2008.
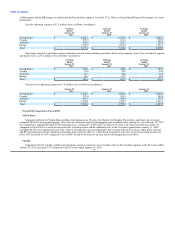
Europe
Segment results for Europe include retail operations in 13 European countries including France, in which we commenced operations on
November 17, 2008 as a result of the Micromania acquisition. As of January 30, 2010, the European segment operated 1,296 stores, compared to
1,201 stores as of January 31, 2009. For the 52 weeks ended January 30, 2010, European sales increased 40.2% compared to the 52 weeks ended
January 31, 2009. The increase in sales was primarily due to the additional sales at the 703 new and acquired stores opened between February 3,
2008 and January 30, 2010, including the 328 stores from the Micromania acquisition in November 2008. This increase in sales was offset by the
decrease in sales at existing stores and the unfavorable impact of changes in exchange rates recognized in fiscal 2009, which had the effect of
decreasing sales by $15.3 million when 39