GameStop 2010 Annual Report Download - page 111
Download and view the complete annual report
Please find page 111 of the 2010 GameStop annual report below. You can navigate through the pages in the report by either clicking on the pages listed below, or by using the keyword search tool below to find specific information within the annual report.-
 1
1 -
2
-
3
-
4
-
5
-
6
-
7
-
8
-
9
-
10
-
11
-
12
-
13
-
14
-
15
-
16
-
17
-
18
-
19
-
20
-
21
-
22
-
23
-
24
-
25
-
26
-
27
-
28
-
29
-
30
-
31
-
32
-
33
-
34
-
35
-
36
-
37
-
38
-
39
-
40
-
41
-
42
-
43
-
44
-
45
-
46
-
47
-
48
-
49
-
50
-
51
-
52
-
53
-
54
-
55
-
56
-
57
-
58
-
59
-
60
-
61
-
62
-
63
-
64
-
65
-
66
-
67
-
68
-
69
-
70
-
71
-
72
-
73
-
74
-
75
-
76
-
77
-
78
-
79
-
80
-
81
-
82
-
83
-
84
-
85
-
86
-
87
-
88
-
89
-
90
-
91
-
92
-
93
-
94
-
95
-
96
-
97
-
98
-
99
-
100
-
 101
101 -
 102
102 -
 103
103 -
 104
104 -
 105
105 -
 106
106 -
 107
107 -
 108
108 -
 109
109 -
 110
110 -
 111
111 -
 112
112 -
 113
113 -
 114
114 -
 115
115 -
 116
116 -
 117
117 -
 118
118 -
 119
119 -
 120
120 -
 121
121 -
122
-
123
-
124
-
125
-
126
-
127
-
128
-
129
-
130
-
131
-
132
-
133
-
134
-
135
-
136
-
137
-
138
-
139
-
140
-
141
-
142
-
143
 |
 |
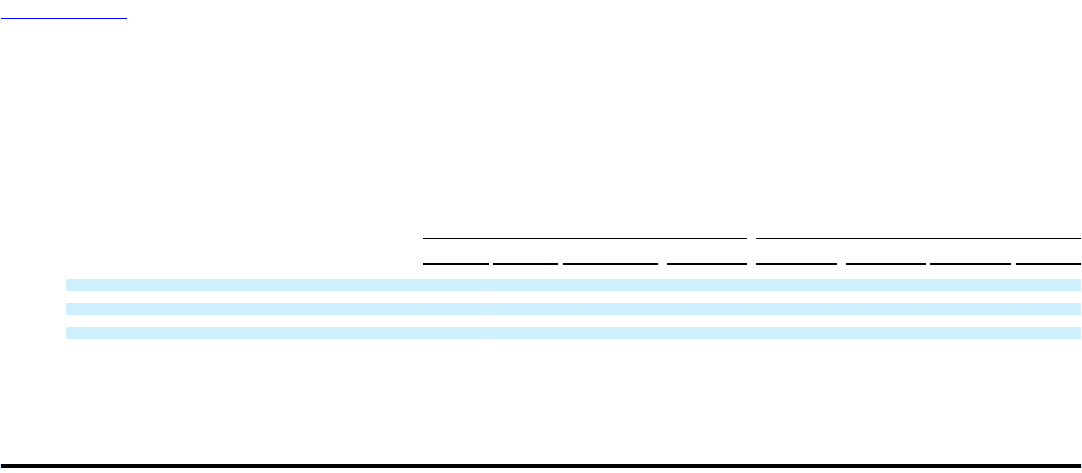
Table of Contents
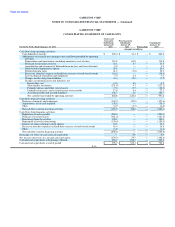
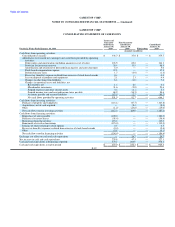
GAMESTOP CORP.
NOTES TO CONSOLIDATED FINANCIAL STATEMENTS — (Continued)
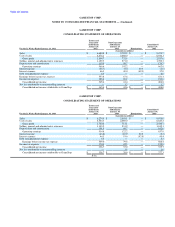
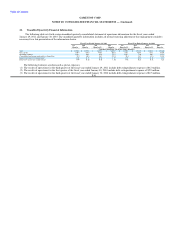
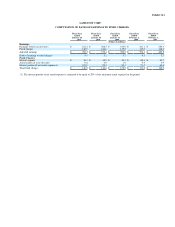
21. Unaudited Quarterly Financial Information
The following table sets forth certain unaudited quarterly consolidated statement of operations information for the fiscal years ended
January 29, 2011 and January 30, 2010. The unaudited quarterly information includes all normal recurring adjustments that management considers
necessary for a fair presentation of the information shown.
Fiscal Year Ended January 29, 2011 Fiscal Year Ended January 30, 2010
1st 2nd 3rd 4th 1st 2nd 3rd 4th
Quarter Quarter Quarter(1) Quarter Quarter(2) Quarter Quarter(3) Quarter
(Amounts in millions, except per share amounts)
Sales $ 2,082.7 $ 1,799.1 $ 1,899.2 $ 3,692.8 $ 1,980.8 $ 1,738.5 $ 1,834.7 $ 3,524.0
Gross profit 570.8 516.8 546.3 903.7 542.1 495.4 523.1 874.0
Operating earnings 124.4 69.6 92.8 375.7 128.5 71.0 90.3 347.4
Consolidated net income attributable to GameStop 75.2 40.3 54.7 237.8 70.4 38.7 52.2 215.9
Basic net income per common share 0.49 0.27 0.36 1.58 0.43 0.23 0.32 1.31
Diluted net income per common share 0.48 0.26 0.36 1.56 0.42 0.23 0.31 1.29
The following footnotes are discussed as pretax expenses.
(1) The results of operations for the third quarter of the fiscal year ended January 29, 2011 include debt extinguishment expense of $6.0 million.
(2) The results of operations for the first quarter of the fiscal year ended January 30, 2010 include debt extinguishment expense of $2.9 million.
(3) The results of operations for the third quarter of the fiscal year ended January 30, 2010 include debt extinguishment expense of $2.5 million.
F-41