GE 2014 Annual Report Download - page 88
Download and view the complete annual report
Please find page 88 of the 2014 GE annual report below. You can navigate through the pages in the report by either clicking on the pages listed below, or by using the keyword search tool below to find specific information within the annual report.-
 1
1 -
2
-
3
-
4
-
5
-
6
-
7
-
8
-
9
-
10
-
11
-
12
-
13
-
14
-
15
-
16
-
17
-
18
-
19
-
20
-
21
-
22
-
23
-
24
-
25
-
26
-
27
-
28
-
29
-
30
-
31
-
32
-
33
-
34
-
35
-
36
-
37
-
38
-
39
-
40
-
41
-
42
-
43
-
44
-
45
-
46
-
47
-
48
-
49
-
50
-
51
-
52
-
53
-
54
-
55
-
56
-
57
-
58
-
59
-
60
-
61
-
62
-
63
-
64
-
65
-
66
-
67
-
68
-
69
-
70
-
71
-
72
-
73
-
74
-
75
-
76
-
77
-
 78
78 -
 79
79 -
 80
80 -
 81
81 -
 82
82 -
 83
83 -
 84
84 -
 85
85 -
 86
86 -
 87
87 -
 88
88 -
 89
89 -
 90
90 -
 91
91 -
 92
92 -
 93
93 -
 94
94 -
 95
95 -
 96
96 -
 97
97 -
 98
98 -
99
-
100
-
101
-
102
-
103
-
104
-
105
-
106
-
107
-
108
-
109
-
110
-
111
-
112
-
113
-
114
-
115
-
116
-
117
-
118
-
119
-
120
-
121
-
122
-
123
-
124
-
125
-
126
-
127
-
128
-
129
-
130
-
131
-
132
-
133
-
134
-
135
-
136
-
137
-
138
-
139
-
140
-
141
-
142
-
143
-
144
-
145
-
146
-
147
-
148
-
149
-
150
-
151
-
152
-
153
-
154
-
155
-
156
-
157
-
158
-
159
-
160
-
161
-
162
-
163
-
164
-
165
-
166
-
167
-
168
-
169
-
170
-
171
-
172
-
173
-
174
-
175
-
176
-
177
-
178
-
179
-
180
-
181
-
182
-
183
-
184
-
185
-
186
-
187
-
188
-
189
-
190
-
191
-
192
-
193
-
194
-
195
-
196
-
197
-
198
-
199
-
200
-
201
-
202
-
203
-
204
-
205
-
206
-
207
-
208
-
209
-
210
-
211
-
212
-
213
-
214
-
215
-
216
-
217
-
218
-
219
-
220
-
221
-
222
-
223
-
224
-
225
-
226
-
227
-
228
-
229
-
230
-
231
-
232
-
233
-
234
-
235
-
236
-
237
-
238
-
239
-
240
-
241
-
242
-
243
-
244
-
245
-
246
-
247
-
248
-
249
-
250
-
251
-
252
-
253
-
254
-
255
-
256
 |
 |

68 GE 2014 FORM 10-K
MD&A OTHER CONSOLIDATED INFORMATION
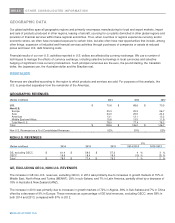
GEOGRAPHIC DATA
Our global activities span all geographic regions and primarily encompass manufacturing for local and export markets, import
and sale of products produced in other regions, leasing of aircraft, sourcing for our plants domiciled in other global regions and
provision of financial services within these regional economies. Thus, when countries or regions experience currency and/or
economic stress, we often have increased exposure to certain risks, but also often have new opportunities that include, among
other things, expansion of industrial and financial services activities through purchases of companies or assets at reduced
prices and lower U.S. debt financing costs.
Financial results of our non-U.S. activities reported in U.S. dollars are affected by currency exchange. We use a number of
techniques to manage the effects of currency exchange, including selective borrowings in local currencies and selective
hedging of significant cross-currency transactions. Such principal currencies are the euro, the pound sterling, the Canadian
dollar, the Japanese yen, the Australian dollar and the Brazilian real.
REVENUES
Revenues are classified according to the region to which products and services are sold. For purposes of this analysis, the
U.S. is presented separately from the remainder of the Americas.
GEOGRAPHIC REVENUES
(Dollars in billions) 2014 2013 2012
U.S. $ 70.6 $ 68.6 $ 70.5
Non-U.S.
Euro
p
e 25.3 25.3 26.7
Asia 24.0 25.5 24.4
Americas 13.1 13.1 13.2
Middle East and Africa 15.6 13.5 11.9
Total Non-U.S. 78.0 77.4 76.2
Total $ 148.6 $ 146.0 $ 146.7
Non-U.S. Revenues as a % of Consolidated Revenues 52% 53% 52%
NON-U.S. REVENUES
V%
(Dollars in billions) 2014 2013 2012 2014-2013 2013-2012
GE, excludin
g
GECC $ 61.4 $ 59.0 $ 57.3 4 % 3 %
GECC 16.6 18.4 19.0
(
10
)
%
(
3
)
%
Total $ 78.0 $ 77.4 $ 76.2 1 % 2 %
GE, EXCLUDING GECC, NON-U.S. REVENUES
The increase in GE non-U.S. revenues, excluding GECC, in 2014 was primarily due to increases in growth markets of 15% in
Middle East, North Africa and Turkey (MENAT), 29% in sub-Sahara, and 7% in Latin America, partially offset by a decrease of
18% in Australia & New Zealand (ANZ).
The increase in 2013 was primarily due to increases in growth markets of 72% in Algeria, 38% in Sub-Sahara and 7% in China
offset by a decrease of 9% in Europe. These revenues as a percentage of GE total revenues, excluding GECC, were 58% in
both 2014 and 2013, compared with 57% in 2012.