GE 2014 Annual Report Download - page 109
Download and view the complete annual report
Please find page 109 of the 2014 GE annual report below. You can navigate through the pages in the report by either clicking on the pages listed below, or by using the keyword search tool below to find specific information within the annual report.-
 1
1 -
2
-
3
-
4
-
5
-
6
-
7
-
8
-
9
-
10
-
11
-
12
-
13
-
14
-
15
-
16
-
17
-
18
-
19
-
20
-
21
-
22
-
23
-
24
-
25
-
26
-
27
-
28
-
29
-
30
-
31
-
32
-
33
-
34
-
35
-
36
-
37
-
38
-
39
-
40
-
41
-
42
-
43
-
44
-
45
-
46
-
47
-
48
-
49
-
50
-
51
-
52
-
53
-
54
-
55
-
56
-
57
-
58
-
59
-
60
-
61
-
62
-
63
-
64
-
65
-
66
-
67
-
68
-
69
-
70
-
71
-
72
-
73
-
74
-
75
-
76
-
77
-
78
-
79
-
80
-
81
-
82
-
83
-
84
-
85
-
86
-
87
-
88
-
89
-
90
-
91
-
92
-
93
-
94
-
95
-
96
-
97
-
98
-
 99
99 -
 100
100 -
 101
101 -
 102
102 -
 103
103 -
 104
104 -
 105
105 -
 106
106 -
 107
107 -
 108
108 -
 109
109 -
 110
110 -
 111
111 -
 112
112 -
 113
113 -
 114
114 -
 115
115 -
 116
116 -
 117
117 -
 118
118 -
 119
119 -
120
-
121
-
122
-
123
-
124
-
125
-
126
-
127
-
128
-
129
-
130
-
131
-
132
-
133
-
134
-
135
-
136
-
137
-
138
-
139
-
140
-
141
-
142
-
143
-
144
-
145
-
146
-
147
-
148
-
149
-
150
-
151
-
152
-
153
-
154
-
155
-
156
-
157
-
158
-
159
-
160
-
161
-
162
-
163
-
164
-
165
-
166
-
167
-
168
-
169
-
170
-
171
-
172
-
173
-
174
-
175
-
176
-
177
-
178
-
179
-
180
-
181
-
182
-
183
-
184
-
185
-
186
-
187
-
188
-
189
-
190
-
191
-
192
-
193
-
194
-
195
-
196
-
197
-
198
-
199
-
200
-
201
-
202
-
203
-
204
-
205
-
206
-
207
-
208
-
209
-
210
-
211
-
212
-
213
-
214
-
215
-
216
-
217
-
218
-
219
-
220
-
221
-
222
-
223
-
224
-
225
-
226
-
227
-
228
-
229
-
230
-
231
-
232
-
233
-
234
-
235
-
236
-
237
-
238
-
239
-
240
-
241
-
242
-
243
-
244
-
245
-
246
-
247
-
248
-
249
-
250
-
251
-
252
-
253
-
254
-
255
-
256
 |
 |

GE 2014 FORM 10-K 89
MD&A CRITICAL ACCOUNTING ESTIMATES
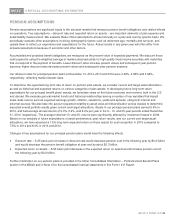
PENSION ASSUMPTIONS
Pension assumptions are significant inputs to the actuarial models that measure pension benefit obligations and related effects
on operations. Two assumptions – discount rate and expected return on assets – are important elements of plan expense and
asset/liability measurement. We evaluate these critical assumptions at least annually on a plan and country-specific basis. We
periodically evaluate other assumptions involving demographic factors such as retirement age, mortality and turnover, and
update them to reflect our experience and expectations for the future. Actual results in any given year will often differ from
actuarial assumptions because of economic and other factors.
Accumulated and projected benefit obligations are measured as the present value of expected payments. We discount those
cash payments using the weighted average of market-observed yields for high-quality fixed-income securities with maturities
that correspond to the payment of benefits. Lower discount rates increase present values and subsequent-year pension
expense; higher discount rates decrease present values and subsequent-year pension expense.
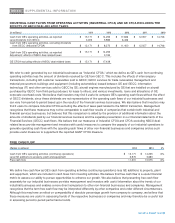
Our discount rates for principal pension plans at December 31, 2014, 2013 and 2012 were 4.02%, 4.85% and 3.96%,
respectively, reflecting market interest rates.
To determine the expected long-term rate of return on pension plan assets, we consider current and target asset allocations,
as well as historical and expected returns on various categories of plan assets. In developing future long-term return
expectations for our principal benefit plans’ assets, we formulate views on the future economic environment, both in the U.S.
and abroad. We evaluate general market trends and historical relationships among a number of key variables that impact
asset class returns such as expected earnings growth, inflation, valuations, yields and spreads, using both internal and
external sources. We also take into account expected volatility by asset class and diversification across classes to determine
expected overall portfolio results given current and target allocations. Assets in our principal pension plans earned 5.9% in
2014, and had average annual returns of 9.0%, 5.9%, and 8.4% per year in the 5-, 10- and 25-year periods ended December
31, 2014, respectively. The average historical 10- and 25- returns were significantly affected by investment losses in 2008.
Based on our analysis of future expectations of asset performance, past return results, and our current and target asset
allocations, we have assumed a 7.5% long-term expected return on those assets for cost recognition in 2015 compared to
7.5% in 2014 and 8.0% in 2013 and 2012.
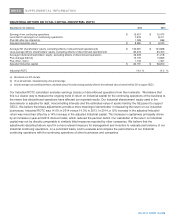
Changes in key assumptions for our principal pension plans would have the following effects.
x Discount rate – A 25 basis point increase in discount rate would decrease pension cost in the following year by $0.2 billion
and would decrease the pension benefit obligation at year-end by about $2.3 billion.
x Expected return on assets – A 50 basis point decrease in the expected return on assets would increase pension cost in
the following year by $0.2 billion.
Further information on our pension plans is provided in the Other Consolidated Information – Postretirement Benefit Plans
section of the MD&A and in Note 12 to the consolidated financial statements in this Form 10-K Report.