GE 2014 Annual Report Download - page 221
Download and view the complete annual report
Please find page 221 of the 2014 GE annual report below. You can navigate through the pages in the report by either clicking on the pages listed below, or by using the keyword search tool below to find specific information within the annual report.-
 1
1 -
2
-
3
-
4
-
5
-
6
-
7
-
8
-
9
-
10
-
11
-
12
-
13
-
14
-
15
-
16
-
17
-
18
-
19
-
20
-
21
-
22
-
23
-
24
-
25
-
26
-
27
-
28
-
29
-
30
-
31
-
32
-
33
-
34
-
35
-
36
-
37
-
38
-
39
-
40
-
41
-
42
-
43
-
44
-
45
-
46
-
47
-
48
-
49
-
50
-
51
-
52
-
53
-
54
-
55
-
56
-
57
-
58
-
59
-
60
-
61
-
62
-
63
-
64
-
65
-
66
-
67
-
68
-
69
-
70
-
71
-
72
-
73
-
74
-
75
-
76
-
77
-
78
-
79
-
80
-
81
-
82
-
83
-
84
-
85
-
86
-
87
-
88
-
89
-
90
-
91
-
92
-
93
-
94
-
95
-
96
-
97
-
98
-
99
-
100
-
101
-
102
-
103
-
104
-
105
-
106
-
107
-
108
-
109
-
110
-
111
-
112
-
113
-
114
-
115
-
116
-
117
-
118
-
119
-
120
-
121
-
122
-
123
-
124
-
125
-
126
-
127
-
128
-
129
-
130
-
131
-
132
-
133
-
134
-
135
-
136
-
137
-
138
-
139
-
140
-
141
-
142
-
143
-
144
-
145
-
146
-
147
-
148
-
149
-
150
-
151
-
152
-
153
-
154
-
155
-
156
-
157
-
158
-
159
-
160
-
161
-
162
-
163
-
164
-
165
-
166
-
167
-
168
-
169
-
170
-
171
-
172
-
173
-
174
-
175
-
176
-
177
-
178
-
179
-
180
-
181
-
182
-
183
-
184
-
185
-
186
-
187
-
188
-
189
-
190
-
191
-
192
-
193
-
194
-
195
-
196
-
197
-
198
-
199
-
200
-
201
-
202
-
203
-
204
-
205
-
206
-
207
-
208
-
209
-
210
-
 211
211 -
 212
212 -
 213
213 -
 214
214 -
 215
215 -
 216
216 -
 217
217 -
 218
218 -
 219
219 -
 220
220 -
 221
221 -
 222
222 -
 223
223 -
 224
224 -
 225
225 -
 226
226 -
 227
227 -
 228
228 -
 229
229 -
 230
230 -
 231
231 -
232
-
233
-
234
-
235
-
236
-
237
-
238
-
239
-
240
-
241
-
242
-
243
-
244
-
245
-
246
-
247
-
248
-
249
-
250
-
251
-
252
-
253
-
254
-
255
-
256
 |
 |

GE 2014 FORM 10-K 201
FINANCIAL STATEMENTS FINANCIAL INSTRUMENTS
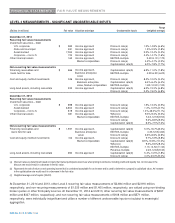
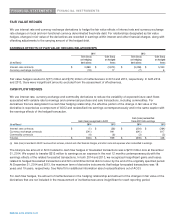
NOTE 22. FINANCIAL INSTRUMENTS
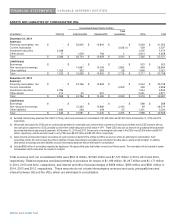
The following table provides information about assets and liabilities not carried at fair value. The table excludes finance leases
and non-financial assets and liabilities. Substantially all of the assets discussed below are considered to be Level 3. The vast
majority of our liabilities’ fair value can be determined based on significant observable inputs and thus considered Level 2. Few
of the instruments are actively traded and their fair values must often be determined using financial models. Realization of the
fair value of these instruments depends upon market forces beyond our control, including marketplace liquidity.
2014 2013
Assets
(
liabilities
)
Assets
(
liabilities
)
Carr
y
in
g
Carr
y
in
g
Notional amoun
t
Estimated Notional amount Estimated
December 31 (In millions) amount (net) fair value amoun
t
(net) fair value
GE
Assets
Investments and notes
receivable $ (a) $ 502 $ 551 $ (a) $ 488 $ 512
Liabilities
Borrowings(b) (a) (16,340) (17,503) (a) (13,356) (13,707)
GECC
Assets
Loans (a) 212,719 217,662 (a) 226,293 230,792
Other commercial mortgages (a) 3,520 3,600 (a) 2,270 2,281
Loans held for sale (a) 1,801 1,826 (a) 512 512
Other financial instruments(c) (a) 691 1,015 (a) 1,622 2,203
Liabilities
Borrowings and bank
deposits(b)(d) (a) (349,548) (366,256) (a) (371,062) (386,823)
Investment contract benefits (a) (2,970) (3,565) (a) (3,144) (3,644)
Guaranteed investment contracts (a) (1,000) (1,031) (a) (1,471) (1,459)
Insurance – credit life(e) 1,843 (90) (77) 2,149 (108) (94)
(a) These financial instruments do not have notional amounts.
(b) See Note 10.
(c) Principally comprises cost method investments.
(d) Fair values exclude interest rate and currency derivatives designated as hedges of borrowings. Had they been included, the fair value of borrowings at December 31,
2014 and 2013 would have been reduced by $5,020 million and $2,284 million, respectively.
(e) Net of reinsurance of $964 million and $1,250 million at December 31, 2014 and 2013, respectively.
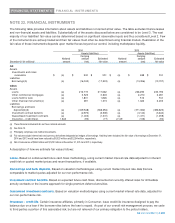
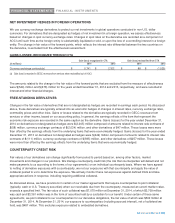
A description of how we estimate fair values follows:
Loans. Based on a discounted future cash flows methodology, using current market interest rate data adjusted for inherent
credit risk or quoted market prices and recent transactions, if available.
Borrowings and bank deposits. Based on valuation methodologies using current market interest rate data that are
comparable to market quotes adjusted for our non-performance risk.
Investment contract benefits. Based on expected future cash flows, discounted at currently offered rates for immediate
annuity contracts or the income approach for single premium deferred annuities.
Guaranteed investment contracts. Based on valuation methodologies using current market interest rate data, adjusted for
our non-performance risk.
Insurance – credit life. Certain insurance affiliates, primarily in Consumer, issue credit life insurance designed to pay the
balance due on a loan if the borrower dies before the loan is repaid. As part of our overall risk management process, we cede
to third parties a portion of this associated risk, but are not relieved of our primary obligation to the policy holders.