GE 2014 Annual Report Download - page 218
Download and view the complete annual report
Please find page 218 of the 2014 GE annual report below. You can navigate through the pages in the report by either clicking on the pages listed below, or by using the keyword search tool below to find specific information within the annual report.-
 1
1 -
2
-
3
-
4
-
5
-
6
-
7
-
8
-
9
-
10
-
11
-
12
-
13
-
14
-
15
-
16
-
17
-
18
-
19
-
20
-
21
-
22
-
23
-
24
-
25
-
26
-
27
-
28
-
29
-
30
-
31
-
32
-
33
-
34
-
35
-
36
-
37
-
38
-
39
-
40
-
41
-
42
-
43
-
44
-
45
-
46
-
47
-
48
-
49
-
50
-
51
-
52
-
53
-
54
-
55
-
56
-
57
-
58
-
59
-
60
-
61
-
62
-
63
-
64
-
65
-
66
-
67
-
68
-
69
-
70
-
71
-
72
-
73
-
74
-
75
-
76
-
77
-
78
-
79
-
80
-
81
-
82
-
83
-
84
-
85
-
86
-
87
-
88
-
89
-
90
-
91
-
92
-
93
-
94
-
95
-
96
-
97
-
98
-
99
-
100
-
101
-
102
-
103
-
104
-
105
-
106
-
107
-
108
-
109
-
110
-
111
-
112
-
113
-
114
-
115
-
116
-
117
-
118
-
119
-
120
-
121
-
122
-
123
-
124
-
125
-
126
-
127
-
128
-
129
-
130
-
131
-
132
-
133
-
134
-
135
-
136
-
137
-
138
-
139
-
140
-
141
-
142
-
143
-
144
-
145
-
146
-
147
-
148
-
149
-
150
-
151
-
152
-
153
-
154
-
155
-
156
-
157
-
158
-
159
-
160
-
161
-
162
-
163
-
164
-
165
-
166
-
167
-
168
-
169
-
170
-
171
-
172
-
173
-
174
-
175
-
176
-
177
-
178
-
179
-
180
-
181
-
182
-
183
-
184
-
185
-
186
-
187
-
188
-
189
-
190
-
191
-
192
-
193
-
194
-
195
-
196
-
197
-
198
-
199
-
200
-
201
-
202
-
203
-
204
-
205
-
206
-
207
-
 208
208 -
 209
209 -
 210
210 -
 211
211 -
 212
212 -
 213
213 -
 214
214 -
 215
215 -
 216
216 -
 217
217 -
 218
218 -
 219
219 -
 220
220 -
 221
221 -
 222
222 -
 223
223 -
 224
224 -
 225
225 -
 226
226 -
 227
227 -
 228
228 -
229
-
230
-
231
-
232
-
233
-
234
-
235
-
236
-
237
-
238
-
239
-
240
-
241
-
242
-
243
-
244
-
245
-
246
-
247
-
248
-
249
-
250
-
251
-
252
-
253
-
254
-
255
-
256
 |
 |
198 GE 2014 FORM 10-K
FINANCIAL STATEMENTS FAIR VALUE MEASUREMENTS
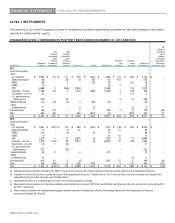
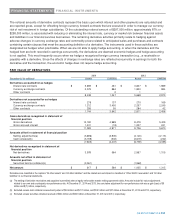
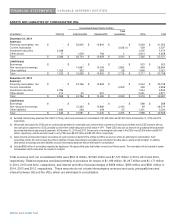
LEVEL 3 INSTRUMENTS
The majority of our Level 3 balances consist of investment securities classified as available-for-sale with changes in fair value
recorded in shareowners’ equity.
CHANGES IN LEVEL 3 INSTRUMENTS FOR THE YEARS ENDED DECEMBER 31, 2014 AND 2013
Balance at
January 1
Net
realized/
unrealized
gains
(losses)
Included in
earnings(a)
Net
realized
/
unrealized
gains
(losses)
included
in AOCI
Purchases
Sales
Settlements
Transfers
into
Level 3(b)
Transfers
out o
f
Level 3(b)
Balance at
December 31
Net
change in
unrealized
gains
(losses)
relating to
instruments
still held at
December 31(c)
(In millions)
2014
Investment securities
Debt
U.S. corporate $ 2,953 $ 22 $ 121 $ 550 $
(
234
)
$
(
284
)
$ 175 $
(
163
)
$ 3,140 $ -
State and municipal 96 - 38 18
(
36
)
(
10
)
472 - 578 -
RMBS 86 - 2 -
(
16
)
(
9
)
-
(
47
)
16 -
CMBS 10 - - - -
(
3
)
2 - 9 -
ABS 6,898 3
(
206
)
2,249 -
(
1,359
)
-
(
10
)
7,575 -
Corporate – non-U.S. 1,064 30 3 1,019
(
269
)
(
1,033
)
1
(
19
)
796 -
Government – non-U.S. 31 - - - - - 2
(
31
)
2 -
U.S. government and
federal agency 225 - 34 - - - 9
(
2
)
266 -
Retained interests 72 29
(
4
)
3
(
66
)
(
10
)
- - 24 -
Equity
Available-for-sale 11 - - 2
(
2
)
- -
(
2
)
9 -
Derivatives(d)(e) 164 60 1 5 -
(
93
)
2
(
1
)
138
(
26
)
Other 494 86 - 646
(
617
)
(
6
)
-
(
279
)
324 73
Total $ 12
,
104 $ 230 $
(
11
)
$ 4
,
492 $
(
1
,
240
)
$
(
2
,
807
)
$ 663 $
(
554
)
$ 12
,
877 $ 47
2013
Investment securities
Debt
U.S. corporate $ 3,591 $
(
497
)
$ 135 $ 380 $
(
424
)
$
(
231
)
$ 108 $
(
109
)
$ 2,953 $ -
State and municipal 77 -
(
7
)
21 -
(
5
)
10 - 96 -
RMBS 100 -
(
5
)
-
(
2
)
(
7
)
- - 86 -
CMBS 6 - - - -
(
6
)
10 - 10 -
ABS 5,023 5 32 2,632
(
4
)
(
795
)
12
(
7
)
6,898 -
Corporate – non-U.S. 1,218
(
103
)
49 5,814
(
3
)
(
5,874
)
21
(
58
)
1,064 -
Government – non-U.S. 42 1
(
12
)
- - - - - 31 -
U.S. government and
federal agency 277 -
(
52
)
- - - - - 225 -
Retained interests 83 3 1 6 -
(
21
)
- - 72 -
Equity
Available-for-sale 13 - - - - - -
(
2
)
11 -
Derivatives(d)(e) 416 43 2
(
2
)
-
(
335
)
37 3 164
(
30
)
Other 799
(
68
)
12 538
(
779
)
- 4
(
12
)
494
(
102
)
Total $ 11
,
645 $
(
616
)
$ 155 $ 9
,
389 $
(
1
,
212
)
$
(
7
,
274
)
$ 202 $
(
185
)
$ 12
,
104 $
(
132
)
(a) Earnings effects are primarily included in the “GECC revenues from services” and “Interest and other financial charges” captions in the Statement of Earnings.
(b) Transfers in and out of Level 3 are considered to occur at the beginning of the period. Transfers out of Level 3 were primarily a result of increased use of quotes from
independent pricing vendors based on recent trading activity.
(c) Represents the amount of unrealized gains or losses for the period included in earnings.
(d) Represents derivative assets net of derivative liabilities and included cash accruals of $12 million and $9 million not reflected in the fair value hierarchy table during 2014
and 2013, respectively.
(e) Gains (losses) included in net realized/unrealized gains (losses) included in earnings were offset by the earnings effects from the underlying items that were
economically hedged. See Note 22.