GE 2014 Annual Report Download - page 214
Download and view the complete annual report
Please find page 214 of the 2014 GE annual report below. You can navigate through the pages in the report by either clicking on the pages listed below, or by using the keyword search tool below to find specific information within the annual report.-
 1
1 -
2
-
3
-
4
-
5
-
6
-
7
-
8
-
9
-
10
-
11
-
12
-
13
-
14
-
15
-
16
-
17
-
18
-
19
-
20
-
21
-
22
-
23
-
24
-
25
-
26
-
27
-
28
-
29
-
30
-
31
-
32
-
33
-
34
-
35
-
36
-
37
-
38
-
39
-
40
-
41
-
42
-
43
-
44
-
45
-
46
-
47
-
48
-
49
-
50
-
51
-
52
-
53
-
54
-
55
-
56
-
57
-
58
-
59
-
60
-
61
-
62
-
63
-
64
-
65
-
66
-
67
-
68
-
69
-
70
-
71
-
72
-
73
-
74
-
75
-
76
-
77
-
78
-
79
-
80
-
81
-
82
-
83
-
84
-
85
-
86
-
87
-
88
-
89
-
90
-
91
-
92
-
93
-
94
-
95
-
96
-
97
-
98
-
99
-
100
-
101
-
102
-
103
-
104
-
105
-
106
-
107
-
108
-
109
-
110
-
111
-
112
-
113
-
114
-
115
-
116
-
117
-
118
-
119
-
120
-
121
-
122
-
123
-
124
-
125
-
126
-
127
-
128
-
129
-
130
-
131
-
132
-
133
-
134
-
135
-
136
-
137
-
138
-
139
-
140
-
141
-
142
-
143
-
144
-
145
-
146
-
147
-
148
-
149
-
150
-
151
-
152
-
153
-
154
-
155
-
156
-
157
-
158
-
159
-
160
-
161
-
162
-
163
-
164
-
165
-
166
-
167
-
168
-
169
-
170
-
171
-
172
-
173
-
174
-
175
-
176
-
177
-
178
-
179
-
180
-
181
-
182
-
183
-
184
-
185
-
186
-
187
-
188
-
189
-
190
-
191
-
192
-
193
-
194
-
195
-
196
-
197
-
198
-
199
-
200
-
201
-
202
-
203
-
 204
204 -
 205
205 -
 206
206 -
 207
207 -
 208
208 -
 209
209 -
 210
210 -
 211
211 -
 212
212 -
 213
213 -
 214
214 -
 215
215 -
 216
216 -
 217
217 -
 218
218 -
 219
219 -
 220
220 -
 221
221 -
 222
222 -
 223
223 -
 224
224 -
225
-
226
-
227
-
228
-
229
-
230
-
231
-
232
-
233
-
234
-
235
-
236
-
237
-
238
-
239
-
240
-
241
-
242
-
243
-
244
-
245
-
246
-
247
-
248
-
249
-
250
-
251
-
252
-
253
-
254
-
255
-
256
 |
 |

194 GE 2014 FORM 10-K
FINANCIAL STATEMENTS GECC REVENUES & SUPPLEMENTAL COST INFORMATION
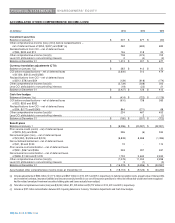
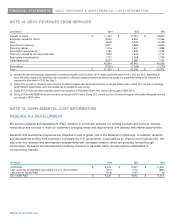
NOTE 18. GECC REVENUES FROM SERVICES
(
In millions
)
2014 2013 2012
Interest on loans $ 17,324 $ 17,951 $ 18,843
Equipment leased to others 9,940 9,804 10,456
Fees 4,618 4,720 4,709
Investment income(a) 2,271 1,809 2,630
Financing leases 1,416 1,667 1,888
Associated companies(b) 1,182 1,809 1,538
Premiums earned by insurance activities 1,509 1,573 1,715
Real estate investments(c) 1,727 2,528 1,709
Other items(a)(d) 2,617 2,080 1,757
42,604 43,941 45,245
Eliminations (1,551) (1,546) (1,273)
Total $ 41,053 $ 42,395 $ 43,972
(a) Included net other-than-temporary impairments on investment securities of $(173) million, $(747) million and $(140) million in 2014, 2013 and 2012, respectively, of
which $96 million related to the impairment of an investment in a Brazilian company that was fully offset by the benefit of a guarantee provided by GE reflected as a
component in other items for 2013. See Note 3.
(b) During 2013, we sold our remaining equity interest in the Bank of Ayudhya (Bay Bank) and recorded a pre-tax gain of $641 million. During 2012, we sold our remaining
equity interest in Garanti Bank, which was classified as an available-for-sale security.
(c) During 2013, we sold real estate comprising certain floors located at 30 Rockefeller Center, New York for a pre-tax gain of $902 million.
(d) During 2014, we sold GEMB-Nordic and recorded a pre-tax gain of $473 million. During 2013, we sold a portion of Cembra through an initial public offering and recorded
a pre-tax gain of $351 million.
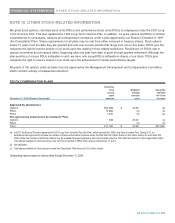
NOTE 19. SUPPLEMENTAL COST INFORMATION
RESEARCH & DEVELOPMENT
We conduct research and development (R&D) activities to continually enhance our existing products and services, develop
new product and services to meet our customer’s changing needs and requirements, and address new market opportunities.
Research and development expenses are classified in cost of goods sold in the Statement of Earnings. In addition, research
and development funding from customers, principally the U.S. government, is recorded as an offset to cost of goods sold. We
also enter into research and development arrangements with unrelated investors, which are generally formed through
partnerships. Research and development funded by investors is classified within net earnings/loss attributable to
noncontrolling interests.
,QPLOOLRQV
2014 2013 2012
Total R&D
$
5,273
$
5,461
$
5,200
Less customer funded R&D (principall
y
the U.S. Government) (721) (711) (680)
Less partner funded R&D (319) (107) (6)
GE funded R&D
$
4,233
$
4,643
$
4,514
FINANCIAL STATEMENTS