GE 2014 Annual Report Download - page 13
Download and view the complete annual report
Please find page 13 of the 2014 GE annual report below. You can navigate through the pages in the report by either clicking on the pages listed below, or by using the keyword search tool below to find specific information within the annual report.-
 1
1 -
2
-
 3
3 -
 4
4 -
 5
5 -
 6
6 -
 7
7 -
 8
8 -
 9
9 -
 10
10 -
 11
11 -
 12
12 -
 13
13 -
 14
14 -
 15
15 -
 16
16 -
 17
17 -
 18
18 -
 19
19 -
 20
20 -
 21
21 -
 22
22 -
 23
23 -
24
-
25
-
26
-
27
-
28
-
29
-
30
-
31
-
32
-
33
-
34
-
35
-
36
-
37
-
38
-
39
-
40
-
41
-
42
-
43
-
44
-
45
-
46
-
47
-
48
-
49
-
50
-
51
-
52
-
53
-
54
-
55
-
56
-
57
-
58
-
59
-
60
-
61
-
62
-
63
-
64
-
65
-
66
-
67
-
68
-
69
-
70
-
71
-
72
-
73
-
74
-
75
-
76
-
77
-
78
-
79
-
80
-
81
-
82
-
83
-
84
-
85
-
86
-
87
-
88
-
89
-
90
-
91
-
92
-
93
-
94
-
95
-
96
-
97
-
98
-
99
-
100
-
101
-
102
-
103
-
104
-
105
-
106
-
107
-
108
-
109
-
110
-
111
-
112
-
113
-
114
-
115
-
116
-
117
-
118
-
119
-
120
-
121
-
122
-
123
-
124
-
125
-
126
-
127
-
128
-
129
-
130
-
131
-
132
-
133
-
134
-
135
-
136
-
137
-
138
-
139
-
140
-
141
-
142
-
143
-
144
-
145
-
146
-
147
-
148
-
149
-
150
-
151
-
152
-
153
-
154
-
155
-
156
-
157
-
158
-
159
-
160
-
161
-
162
-
163
-
164
-
165
-
166
-
167
-
168
-
169
-
170
-
171
-
172
-
173
-
174
-
175
-
176
-
177
-
178
-
179
-
180
-
181
-
182
-
183
-
184
-
185
-
186
-
187
-
188
-
189
-
190
-
191
-
192
-
193
-
194
-
195
-
196
-
197
-
198
-
199
-
200
-
201
-
202
-
203
-
204
-
205
-
206
-
207
-
208
-
209
-
210
-
211
-
212
-
213
-
214
-
215
-
216
-
217
-
218
-
219
-
220
-
221
-
222
-
223
-
224
-
225
-
226
-
227
-
228
-
229
-
230
-
231
-
232
-
233
-
234
-
235
-
236
-
237
-
238
-
239
-
240
-
241
-
242
-
243
-
244
-
245
-
246
-
247
-
248
-
249
-
250
-
251
-
252
-
253
-
254
-
255
-
256
 |
 |
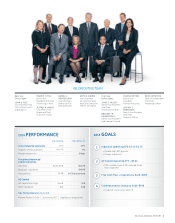
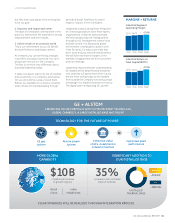
Our industrial performance was broad-
based with 5/7 segments growing. Industrial
organic revenue growth was 7%, sub-
stantially above our peers. We ended the
year with $261 billion of backlog, a record.
Margins expanded to 16.2%. We contin-
ued to see the benefi ts from simplifi cation
and our productivity programs. CFOA
was $15.2 billion, and free cash fl ow was
$11.2 billion, up 6%. We had solid perfor-
mance on cash, but there is room for upside
in the future.
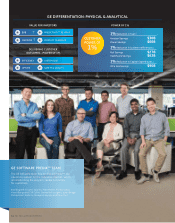
Our goal is to hit 17% margins and returns
by 2016. Over the last few years, we
have made substantial progress on our
structural cost, reducing it by $4 billion
to a world-class level. The next wave of
improvement will be targeting product
cost, segment gross margins and returns.
GE has approximately a $100 billion cost
base, 70% of which are direct product
and service costs. Our “segment gross
margins,” the revenue in excess of these
costs, are 27%.
with a cycle of days and weeks. Because
of our industrial context, we can rapidly
co-create applications with customers. We
think of our Software COE as an Industrial
Internet “App Factory” producing outcomes
ranging from asset synchronization to
reducing unplanned downtime.
The Industrial Internet will transform GE.
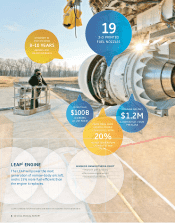
Wind is one of our newest businesses.
“PowerUp” is a Predictivity app that
increases wind farm output by 5% and
profi tability by 20% through controls and
analytics. Lighting is our oldest business.
The combination of LEDs and analytics puts
a computer where a light bulb used to be.
In cities around the world, GE is working to
transform street lighting into the analytical
brain of urban life. Today, Lighting is becom-
ing a high-tech infrastructure business.
It is a gateway for most energy manage-
ment solutions.
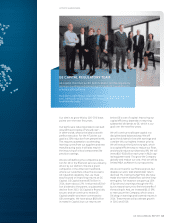
GE will create investor value through our
leadership in the Industrial Internet. Our
deep knowledge of machines is a profound
advantage, and our domain expertise is
necessary to make analytics meaningful.
Because of our existing service relation-
ships with customers, we have a gateway
to create valuable outcomes for them and
profi table growth for GE.
Value Creating Execution
Last year, we asked you to look at our
earnings over a three-year period, from
2014–16. Over that time, we would improve
our earnings mix to more than 75% indus-
trial, return $50 billion to investors
in dividends and share repurchase, while
growing returns and EPS each year.
In 2014, we executed the fi rst phase of that
journey. We grew operating EPS 1% to $1.65.
Our industrial segment profi ts were up 10%,
while fi nancial profi ts declined 12%. GE’s
industrial earnings are about 60% of our total.
GE Capital ENI declined 5% to $363 billion.
GE Capital ended the year with a Tier 1 capi-
tal ratio of 12.7% and $76 billion of liquidity.
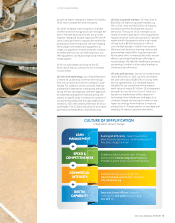
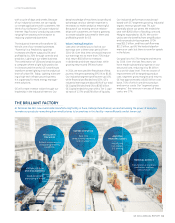
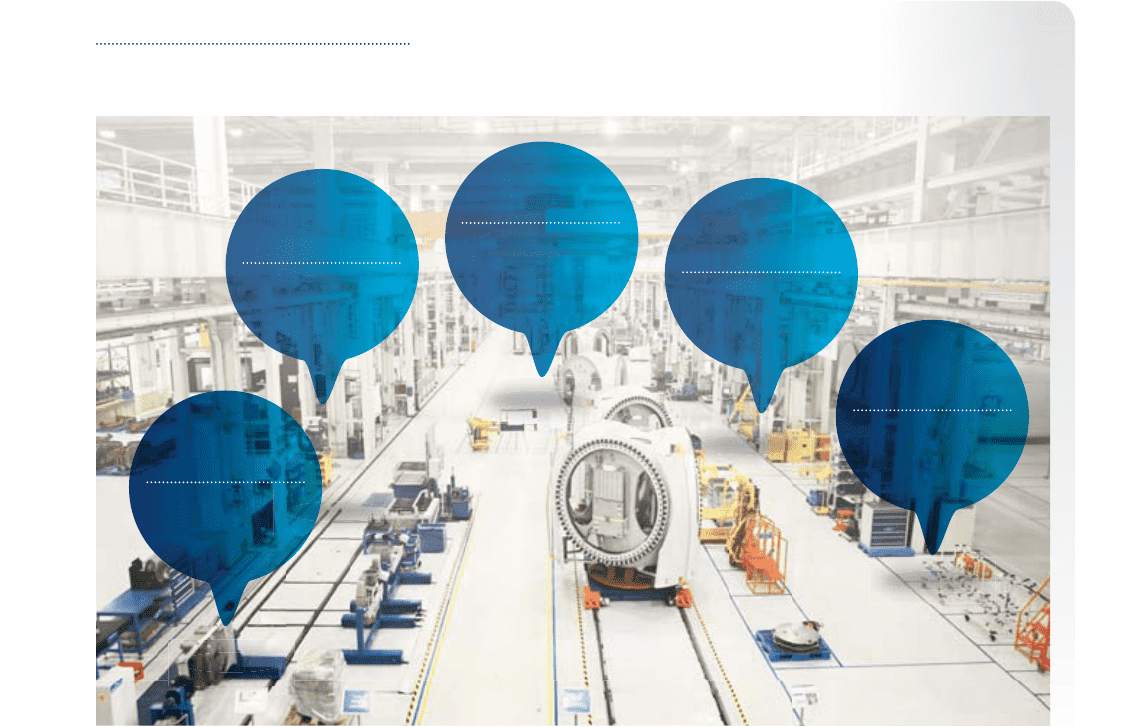
THE BRILLIANT FACTORY
At factories like GE’s new multimodal manufacturing facility in Pune, India (pictured below), we are harnessing the power of analytics
to make our products—everything from wind turbines to locomotives in this facility—more effi ciently and at lower cost.
LETTER TO SHAREOWNERS
INTELLIGENT
MACHINES
Brilliant machines with
remote programming
capabilities
VIRTUAL DESIGN
AND ENGINEERING
Rapid design and
prototyping in-house
MATERIAL SCIENCE
Transformative materials
used across multiple
GE businesses
ADDITIVE
MANUFACTURING
Metallic and
non-metallic
3-D printing
SUPERCOMPUTING
Real-time
computational modeling
and simulation
GE 2014 ANNUAL REPORT 11