GE 2014 Annual Report Download - page 205
Download and view the complete annual report
Please find page 205 of the 2014 GE annual report below. You can navigate through the pages in the report by either clicking on the pages listed below, or by using the keyword search tool below to find specific information within the annual report.-
 1
1 -
2
-
3
-
4
-
5
-
6
-
7
-
8
-
9
-
10
-
11
-
12
-
13
-
14
-
15
-
16
-
17
-
18
-
19
-
20
-
21
-
22
-
23
-
24
-
25
-
26
-
27
-
28
-
29
-
30
-
31
-
32
-
33
-
34
-
35
-
36
-
37
-
38
-
39
-
40
-
41
-
42
-
43
-
44
-
45
-
46
-
47
-
48
-
49
-
50
-
51
-
52
-
53
-
54
-
55
-
56
-
57
-
58
-
59
-
60
-
61
-
62
-
63
-
64
-
65
-
66
-
67
-
68
-
69
-
70
-
71
-
72
-
73
-
74
-
75
-
76
-
77
-
78
-
79
-
80
-
81
-
82
-
83
-
84
-
85
-
86
-
87
-
88
-
89
-
90
-
91
-
92
-
93
-
94
-
95
-
96
-
97
-
98
-
99
-
100
-
101
-
102
-
103
-
104
-
105
-
106
-
107
-
108
-
109
-
110
-
111
-
112
-
113
-
114
-
115
-
116
-
117
-
118
-
119
-
120
-
121
-
122
-
123
-
124
-
125
-
126
-
127
-
128
-
129
-
130
-
131
-
132
-
133
-
134
-
135
-
136
-
137
-
138
-
139
-
140
-
141
-
142
-
143
-
144
-
145
-
146
-
147
-
148
-
149
-
150
-
151
-
152
-
153
-
154
-
155
-
156
-
157
-
158
-
159
-
160
-
161
-
162
-
163
-
164
-
165
-
166
-
167
-
168
-
169
-
170
-
171
-
172
-
173
-
174
-
175
-
176
-
177
-
178
-
179
-
180
-
181
-
182
-
183
-
184
-
185
-
186
-
187
-
188
-
189
-
190
-
191
-
192
-
193
-
194
-
 195
195 -
 196
196 -
 197
197 -
 198
198 -
 199
199 -
 200
200 -
 201
201 -
 202
202 -
 203
203 -
 204
204 -
 205
205 -
 206
206 -
 207
207 -
 208
208 -
 209
209 -
 210
210 -
 211
211 -
 212
212 -
 213
213 -
 214
214 -
 215
215 -
216
-
217
-
218
-
219
-
220
-
221
-
222
-
223
-
224
-
225
-
226
-
227
-
228
-
229
-
230
-
231
-
232
-
233
-
234
-
235
-
236
-
237
-
238
-
239
-
240
-
241
-
242
-
243
-
244
-
245
-
246
-
247
-
248
-
249
-
250
-
251
-
252
-
253
-
254
-
255
-
256
 |
 |

GE 2014 FORM 10-K 185
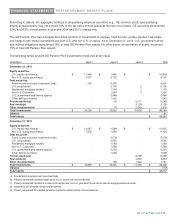
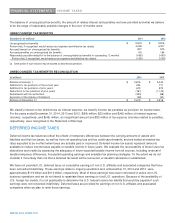
FINANCIAL STATEMENTS INCOME TAXES
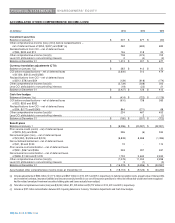
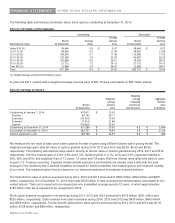
Aggregated deferred income tax amounts are summarized below.
December 31 (In millions) 2014 2013
Assets
GE $ 19,942 $ 15,284
GECC 12,546 13,224
32,488 28,508
Liabilities
GE (11,170) (10,223)
GECC (18,777) (18,010)
(29,947) (28,233)
Net deferred income tax asset (liability) $ 2,541 $ 275
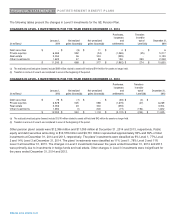
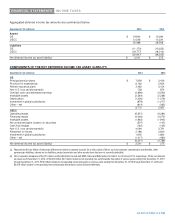
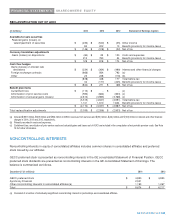
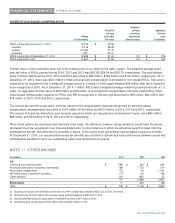
COMPONENTS OF THE NET DEFERRED INCOME TAX ASSET (LIABILITY)
December 31 (In millions) 2014 2013
GE
Principal pension plans $ 7,859 $ 3,436
Provision for expenses(a) 6,192 5,934
Retiree insurance plans 3,462 3,154
Non-U.S. loss carryforwards(b) 738 874
Contract costs and estimated earnings (3,996) (3,550)
Intangible assets (2,364) (2,268)
Depreciation (1,226) (1,079)
Investment in global subsidiaries (979) (1,077)
Other – net (914) (363)
8,772 5,061
GECC
Operating leases (6,351) (6,284)
Financing leases (4,046) (4,075)
Intangible assets (1,963) (1,943)
Net unrealized gains (losses) on securities (507) (145)
Cash flow hedges (162) (163)
Non-U.S. loss carryforwards(b) 4,094 3,791
Allowance for losses 2,186 2,640
Investment in global subsidiaries 1,935 1,883
Other – net (1,417) (490)
(6,231) (4,786)
Net deferred income tax asset (liability) $ 2,541 $ 275
(a) Represented the tax effects of temporary differences related to expense accruals for a wide variety of items, such as employee compensation and benefits, other
pension plan liabilities, interest on tax liabilities, product warranties and other sundry items that are not currently deductible.
(b) Net of valuation allowances of $2,015 million and $2,089 million for GE and $880 million and $862 million for GECC, for 2014 and 2013, respectively. Of the net deferred
tax asset as of December 31, 2014, of $4,832 million, $47 million relates to net operating loss carryforwards that expire in various years ending from December 31, 2015
through December 31, 2017; $166 million relates to net operating losses that expire in various years ending from December 31, 2018 through December 31, 2034 and
$4,619 million relates to net operating loss carryforwards that may be carried forward indefinitely.