GE 2014 Annual Report Download - page 188
Download and view the complete annual report
Please find page 188 of the 2014 GE annual report below. You can navigate through the pages in the report by either clicking on the pages listed below, or by using the keyword search tool below to find specific information within the annual report.-
 1
1 -
2
-
3
-
4
-
5
-
6
-
7
-
8
-
9
-
10
-
11
-
12
-
13
-
14
-
15
-
16
-
17
-
18
-
19
-
20
-
21
-
22
-
23
-
24
-
25
-
26
-
27
-
28
-
29
-
30
-
31
-
32
-
33
-
34
-
35
-
36
-
37
-
38
-
39
-
40
-
41
-
42
-
43
-
44
-
45
-
46
-
47
-
48
-
49
-
50
-
51
-
52
-
53
-
54
-
55
-
56
-
57
-
58
-
59
-
60
-
61
-
62
-
63
-
64
-
65
-
66
-
67
-
68
-
69
-
70
-
71
-
72
-
73
-
74
-
75
-
76
-
77
-
78
-
79
-
80
-
81
-
82
-
83
-
84
-
85
-
86
-
87
-
88
-
89
-
90
-
91
-
92
-
93
-
94
-
95
-
96
-
97
-
98
-
99
-
100
-
101
-
102
-
103
-
104
-
105
-
106
-
107
-
108
-
109
-
110
-
111
-
112
-
113
-
114
-
115
-
116
-
117
-
118
-
119
-
120
-
121
-
122
-
123
-
124
-
125
-
126
-
127
-
128
-
129
-
130
-
131
-
132
-
133
-
134
-
135
-
136
-
137
-
138
-
139
-
140
-
141
-
142
-
143
-
144
-
145
-
146
-
147
-
148
-
149
-
150
-
151
-
152
-
153
-
154
-
155
-
156
-
157
-
158
-
159
-
160
-
161
-
162
-
163
-
164
-
165
-
166
-
167
-
168
-
169
-
170
-
171
-
172
-
173
-
174
-
175
-
176
-
177
-
 178
178 -
 179
179 -
 180
180 -
 181
181 -
 182
182 -
 183
183 -
 184
184 -
 185
185 -
 186
186 -
 187
187 -
 188
188 -
 189
189 -
 190
190 -
 191
191 -
 192
192 -
 193
193 -
 194
194 -
 195
195 -
 196
196 -
 197
197 -
 198
198 -
199
-
200
-
201
-
202
-
203
-
204
-
205
-
206
-
207
-
208
-
209
-
210
-
211
-
212
-
213
-
214
-
215
-
216
-
217
-
218
-
219
-
220
-
221
-
222
-
223
-
224
-
225
-
226
-
227
-
228
-
229
-
230
-
231
-
232
-
233
-
234
-
235
-
236
-
237
-
238
-
239
-
240
-
241
-
242
-
243
-
244
-
245
-
246
-
247
-
248
-
249
-
250
-
251
-
252
-
253
-
254
-
255
-
256
 |
 |
168 GE 2014 FORM 10-K
FINANCIAL STATEMENTS ALL OTHER ASSETS
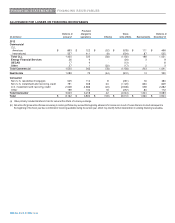
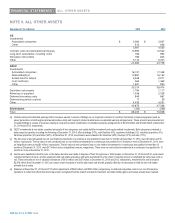
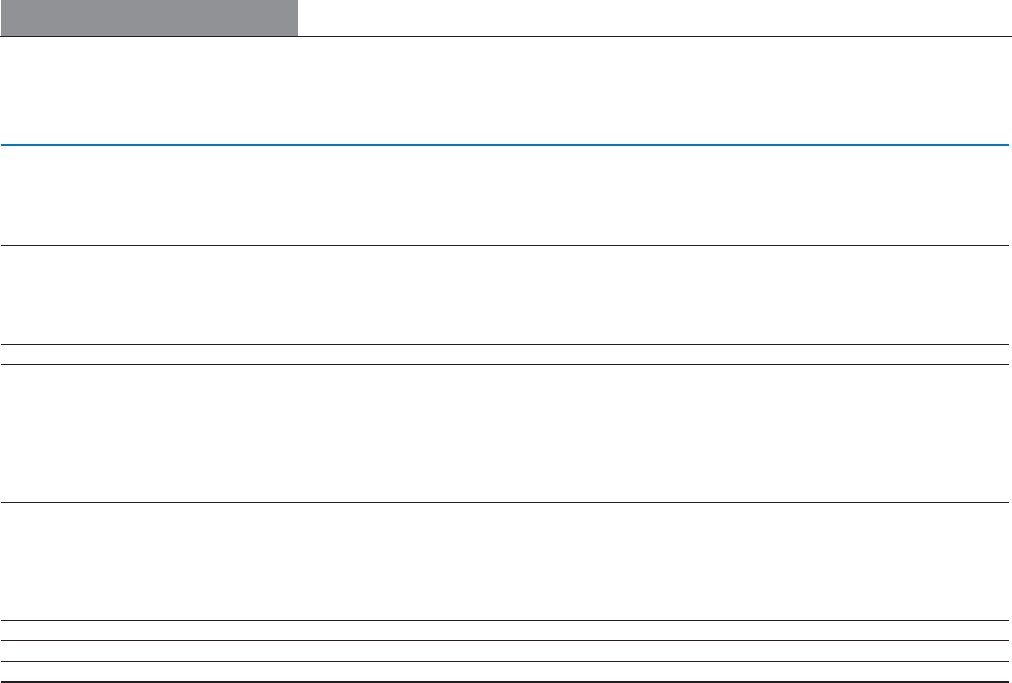
NOTE 9. ALL OTHER ASSETS
December 31 (in millions) 2014 2013
GE
Investments
Associated companies $ 3,384 $ 3,937
Other 613 626
3,997 4,563
Contract costs and estimated earnings(a) 13,990 12,522
Long-term receivables, including notes 766 993
Derivative instruments 783 623
Other 5,144 5,007
24,680 23,708
GECC
Investments
Associated companies 16,747 17,348
Real estate(b)(c) 10,891 16,163
Assets held for sale(d) 5,549 2,571
Cost method(c) 566 1,462
Other 1,621 930
35,374 38,474
Derivative instruments 1,794 1,117
Advances to suppliers 1,406 2,328
Deferred borrowing costs 849 867
Deferred acquisition costs(e) 17 29
Other 4,435 4,551
43,875 47,366
Eliminations (330) (266)
Total $ 68,225 $ 70,808
(a) Contract costs and estimated earnings reflect revenues earned in excess of billings on our long-term contracts to construct technically complex equipment (such as
power generation, aircraft engines and aeroderivative units) and long-term product maintenance or extended warranty arrangements. These amounts are presented net
of related billings in excess of revenues relating to long-term product maintenance or extended warranty arrangements of $2,329 million and $1,842 million at December
31, 2014 and 2013, respectively.
(b) GECC investments in real estate consisted principally of two categories: real estate held for investment and equity method investments. Both categories contained a
wide range of properties including the following at December 31, 2014: office buildings (57%), retail facilities (9%), apartment buildings (5%), industrial properties (3%),
franchise properties (3%) and other (23%). At December 31, 2014, investments were located in the Americas (46%), Europe (37%) and Asia (17%).
(c) The fair value of and unrealized loss on cost method investments in a continuous loss position for less than 12 months at December 31, 2014, were $5 million and $1
million, respectively. The fair value of and unrealized loss on cost method investments in a continuous loss position for 12 months or more at December 31, 2014, were
an insignificant amount and $1 million, respectively. The fair value of and unrealized loss on cost method investments in a continuous loss position for less than 12
months at December 31, 2013, were $17 million and an insignificant amount, respectively. There were no cost method investments in a continuous loss position for 12
months or more at December 31, 2013.
(d) Assets were classified as held for sale on the date a decision was made to dispose of them through sale or other means. At December 31, 2014 and 2013, such assets
consisted primarily of loans, aircraft, equipment and real estate properties, and were accounted for at the lower of carrying amount or estimated fair value less costs to
sell. These amounts are net of valuation allowances of $142 million and $127 million at December 31, 2014 and 2013, respectively. Assets held for sale increased
$2,978 million from December 31, 2013 as a result of net increases in held for sale loans and aircraft, partially offset by net decreases in held for sale real estate,
primarily due to sales.
(e) Balances at December 31, 2014 and 2013 reflect adjustments of $624 million and $700 million, respectively, to deferred acquisition costs in our run-off insurance
operations to reflect the effects that would have been recognized had the related unrealized investment securities holding gains and losses actually been realized.