GE 2014 Annual Report Download - page 212
Download and view the complete annual report
Please find page 212 of the 2014 GE annual report below. You can navigate through the pages in the report by either clicking on the pages listed below, or by using the keyword search tool below to find specific information within the annual report.-
 1
1 -
2
-
3
-
4
-
5
-
6
-
7
-
8
-
9
-
10
-
11
-
12
-
13
-
14
-
15
-
16
-
17
-
18
-
19
-
20
-
21
-
22
-
23
-
24
-
25
-
26
-
27
-
28
-
29
-
30
-
31
-
32
-
33
-
34
-
35
-
36
-
37
-
38
-
39
-
40
-
41
-
42
-
43
-
44
-
45
-
46
-
47
-
48
-
49
-
50
-
51
-
52
-
53
-
54
-
55
-
56
-
57
-
58
-
59
-
60
-
61
-
62
-
63
-
64
-
65
-
66
-
67
-
68
-
69
-
70
-
71
-
72
-
73
-
74
-
75
-
76
-
77
-
78
-
79
-
80
-
81
-
82
-
83
-
84
-
85
-
86
-
87
-
88
-
89
-
90
-
91
-
92
-
93
-
94
-
95
-
96
-
97
-
98
-
99
-
100
-
101
-
102
-
103
-
104
-
105
-
106
-
107
-
108
-
109
-
110
-
111
-
112
-
113
-
114
-
115
-
116
-
117
-
118
-
119
-
120
-
121
-
122
-
123
-
124
-
125
-
126
-
127
-
128
-
129
-
130
-
131
-
132
-
133
-
134
-
135
-
136
-
137
-
138
-
139
-
140
-
141
-
142
-
143
-
144
-
145
-
146
-
147
-
148
-
149
-
150
-
151
-
152
-
153
-
154
-
155
-
156
-
157
-
158
-
159
-
160
-
161
-
162
-
163
-
164
-
165
-
166
-
167
-
168
-
169
-
170
-
171
-
172
-
173
-
174
-
175
-
176
-
177
-
178
-
179
-
180
-
181
-
182
-
183
-
184
-
185
-
186
-
187
-
188
-
189
-
190
-
191
-
192
-
193
-
194
-
195
-
196
-
197
-
198
-
199
-
200
-
201
-
 202
202 -
 203
203 -
 204
204 -
 205
205 -
 206
206 -
 207
207 -
 208
208 -
 209
209 -
 210
210 -
 211
211 -
 212
212 -
 213
213 -
 214
214 -
 215
215 -
 216
216 -
 217
217 -
 218
218 -
 219
219 -
 220
220 -
 221
221 -
 222
222 -
223
-
224
-
225
-
226
-
227
-
228
-
229
-
230
-
231
-
232
-
233
-
234
-
235
-
236
-
237
-
238
-
239
-
240
-
241
-
242
-
243
-
244
-
245
-
246
-
247
-
248
-
249
-
250
-
251
-
252
-
253
-
254
-
255
-
256
 |
 |

192 GE 2014 FORM 10-K
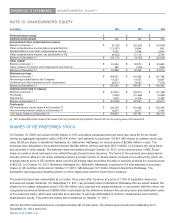
FINANCIAL STATEMENTS OTHER STOCK-RELATED INFORMATION
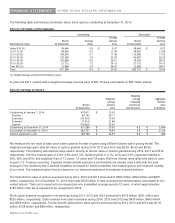
The following table summarizes information about stock options outstanding at December 31, 2014.
STOCK OPTIONS OUTSTANDING
Outstanding Exercisable
Average Average
Shares Average exercise Shares exercise
Exercise price range (In thousands) life(a) price (In thousands) price
Under $10.00 28,484 3.9 $ 9.57 28,484 $ 9.57
10.01-15.00 46,905 4.2 11.98 46,905 11.98
15.01-20.00 158,534 5.7 17.46 113,286 17.32
20.01-25.00 132,295 7.9 22.55 50,587 22.25
25.01-30.00 100,668 8.5 26.51 19,039 28.22
30.01-35.00 21,712 1.2 34.10 21,712 34.10
Over $35.00 12,688 2.4 38.67 12,688 38.57
Total 501,286 6.3 $ 20.92 292,701 $ 19.44
(a) Weighted average contractual life remaining in years.
At year-end 2013, options with a weighted average exercise price of $20.15 were exercisable on 254 million shares.
STOCK OPTION ACTIVITY
Weighted
Weighted average Aggregate
average remaining intrinsic
Shares exercise contractual value
(In thousands) price term (In years) (In millions)
Outstanding at January 1, 2014 473,611 $ 20.02
Granted 82,142 26.11
Exercised (30,433) 14.42
Forfeited (7,414) 21.89
Expired (16,620) 32.40
Outstanding at December 31, 2014 501,286 $ 20.92 6.3 $ 2,668
Exercisable at December 31, 2014 292,701 $ 19.44 4.9 $ 2,124
Options expected to vest 189,186 $ 22.97 8.3 $ 496
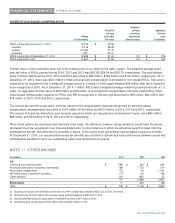
We measure the fair value of each stock option grant at the date of grant using a Black-Scholes option pricing model. The
weighted average grant-date fair value of options granted during 2014, 2013 and 2012 was $5.26, $4.52 and $3.80,
respectively. The following assumptions were used in arriving at the fair value of options granted during 2014, 2013 and 2012,
respectively: risk-free interest rates of 2.3%, 2.5% and 1.3%; dividend yields of 3.1%, 4.0% and 4.0%; expected volatility of
26%, 28% and 29%; and expected lives of 7.3 years, 7.5 years and 7.8 years. Risk-free interest rates reflect the yield on zero-
coupon U.S. Treasury securities. Expected dividend yields presume a set dividend rate and we used a historical five-year
average for the dividend yield. Expected volatilities are based on implied volatilities from traded options and historical volatility
of our stock. The expected option lives are based on our historical experience of employee exercise behavior.
The total intrinsic value of options exercised during 2014, 2013 and 2012 amounted to $360 million, $392 million and $265
million, respectively. As of December 31, 2014, there was $739 million of total unrecognized compensation cost related to non-
vested options. That cost is expected to be recognized over a weighted average period of 2 years, of which approximately
$185 million after tax is expected to be recognized in 2015.
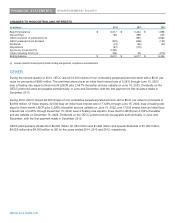
Stock option expense recognized in net earnings during 2014, 2013 and 2012 amounted to $215 million, $231 million and
$220 million, respectively. Cash received from option exercises during 2014, 2013 and 2012 was $439 million, $490 million
and $355 million, respectively. The tax benefit realized from stock options exercised during 2014, 2013 and 2012 was $118
million, $128 million and $88 million, respectively.