GE 2014 Annual Report Download - page 57
Download and view the complete annual report
Please find page 57 of the 2014 GE annual report below. You can navigate through the pages in the report by either clicking on the pages listed below, or by using the keyword search tool below to find specific information within the annual report.-
 1
1 -
2
-
3
-
4
-
5
-
6
-
7
-
8
-
9
-
10
-
11
-
12
-
13
-
14
-
15
-
16
-
17
-
18
-
19
-
20
-
21
-
22
-
23
-
24
-
25
-
26
-
27
-
28
-
29
-
30
-
31
-
32
-
33
-
34
-
35
-
36
-
37
-
38
-
39
-
40
-
41
-
42
-
43
-
44
-
45
-
46
-
 47
47 -
 48
48 -
 49
49 -
 50
50 -
 51
51 -
 52
52 -
 53
53 -
 54
54 -
 55
55 -
 56
56 -
 57
57 -
 58
58 -
 59
59 -
 60
60 -
 61
61 -
 62
62 -
 63
63 -
 64
64 -
 65
65 -
 66
66 -
 67
67 -
68
-
69
-
70
-
71
-
72
-
73
-
74
-
75
-
76
-
77
-
78
-
79
-
80
-
81
-
82
-
83
-
84
-
85
-
86
-
87
-
88
-
89
-
90
-
91
-
92
-
93
-
94
-
95
-
96
-
97
-
98
-
99
-
100
-
101
-
102
-
103
-
104
-
105
-
106
-
107
-
108
-
109
-
110
-
111
-
112
-
113
-
114
-
115
-
116
-
117
-
118
-
119
-
120
-
121
-
122
-
123
-
124
-
125
-
126
-
127
-
128
-
129
-
130
-
131
-
132
-
133
-
134
-
135
-
136
-
137
-
138
-
139
-
140
-
141
-
142
-
143
-
144
-
145
-
146
-
147
-
148
-
149
-
150
-
151
-
152
-
153
-
154
-
155
-
156
-
157
-
158
-
159
-
160
-
161
-
162
-
163
-
164
-
165
-
166
-
167
-
168
-
169
-
170
-
171
-
172
-
173
-
174
-
175
-
176
-
177
-
178
-
179
-
180
-
181
-
182
-
183
-
184
-
185
-
186
-
187
-
188
-
189
-
190
-
191
-
192
-
193
-
194
-
195
-
196
-
197
-
198
-
199
-
200
-
201
-
202
-
203
-
204
-
205
-
206
-
207
-
208
-
209
-
210
-
211
-
212
-
213
-
214
-
215
-
216
-
217
-
218
-
219
-
220
-
221
-
222
-
223
-
224
-
225
-
226
-
227
-
228
-
229
-
230
-
231
-
232
-
233
-
234
-
235
-
236
-
237
-
238
-
239
-
240
-
241
-
242
-
243
-
244
-
245
-
246
-
247
-
248
-
249
-
250
-
251
-
252
-
253
-
254
-
255
-
256
 |
 |
GE 2014 FORM 10-K 37
MD&A SEGMENT OPERATIONS | OIL & GAS
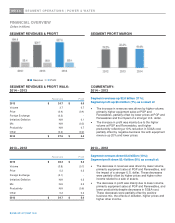
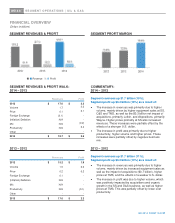
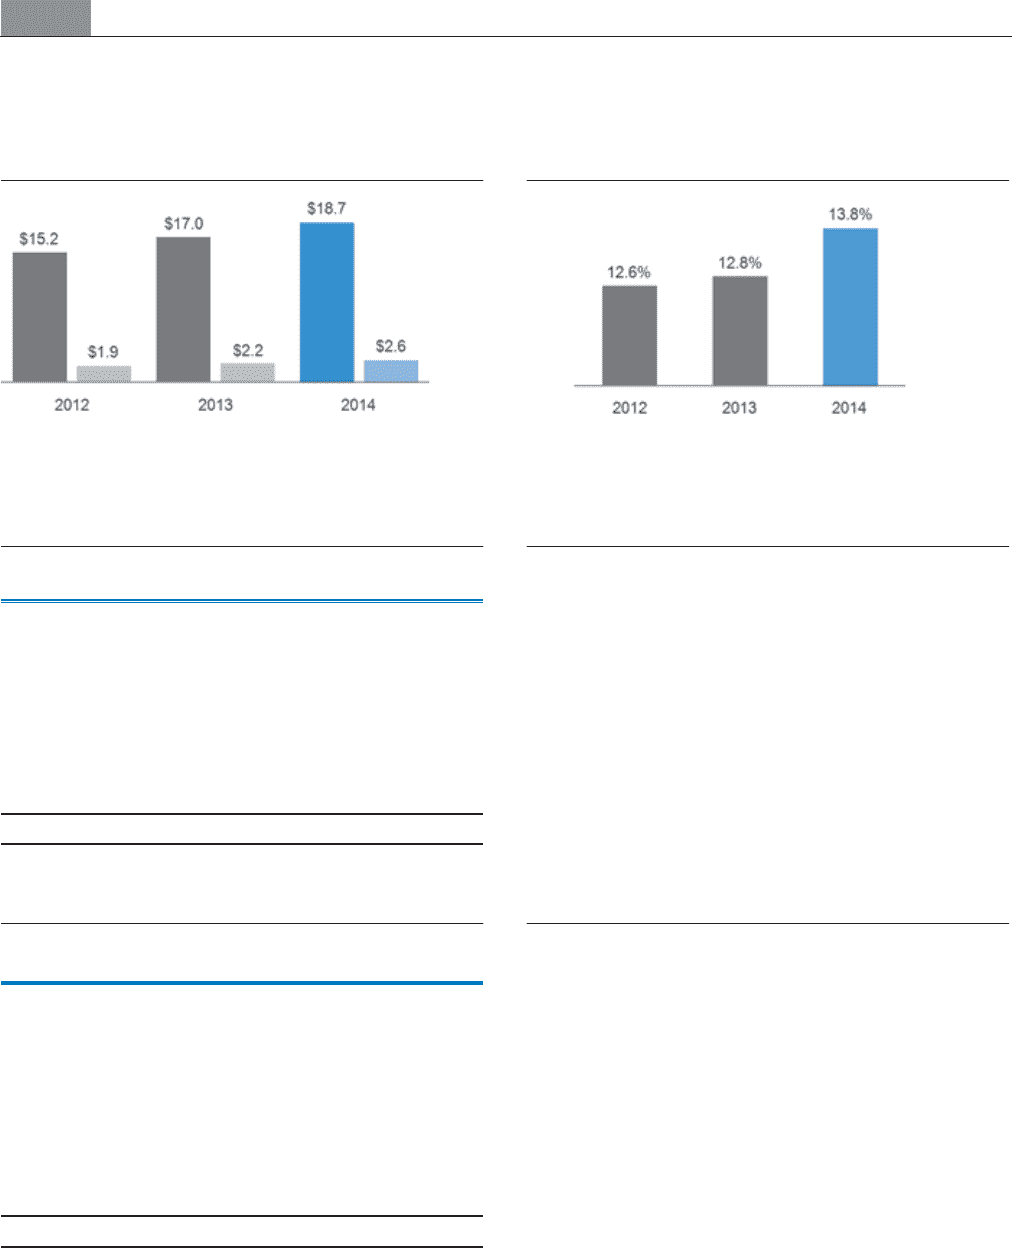
FINANCIAL OVERVIEW
(Dollars in billions)
SEGMENT REVENUES & PROFIT SEGMENT PROFIT MARGIN
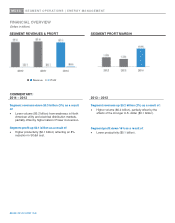
SEGMENT REVENUES & PROFIT WALK: COMMENTARY:
2014 – 2013 2014 – 2013
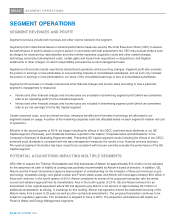
Segment revenues up $1.7 billion (10%);
Segment profit up $0.4 billion (19%) as a result of:
x The increase in revenues was primarily due to higher
volume, mainly driven by higher equipment sales at SS,
D&S and TMS, as well as the $0.3 billion net impact of
acquisitions, primarily Lufkin, and dispositions, primarily
Wayne. Higher prices primarily at SS also increased
revenues. These increases were partially offset by the
effects of a stronger U.S. dollar.
x The increase in profit was primarily due to higher
productivity, higher volume and higher prices. These
increases were partially offset by negative business
mix.
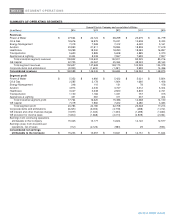
Revenues Profit
2013 $ 17.0 $ 2.2
Volume 1.7 0.2
Price 0.1 0.1
Foreign Exchange (0.1) -
(Inflation)/Deflation N/A -
Mix N/A (0.2)
Productivity N/A 0.4
Other - -
2014 $ 18.7 $ 2.6
2013 – 2012 2013 – 2012
Segment revenues up $1.7 billion (11%);
Segment profit up $0.3 billion (13%) as a result of:
x The increase in revenues was primarily due to higher
volume, mainly driven by increased equipment sales as
well as the impact of acquisitions ($0.7 billion), higher
prices at TMS, and the effects of a weaker U.S. dollar.
x The increase in profit was due to higher volume, which
was positively impacted by acquisitions and organic
growth in the SS and D&S business, as well as higher
prices at TMS. This was partially offset by lower cost
productivity.
Revenues Profit
2012 $ 15.2 $ 1.9
Volume 1.5 0.2
Price 0.2 0.2
Foreign Exchange 0.1 -
(Inflation)/Deflation N/A -
Mix N/A -
Productivity N/A (0.1)
Other - -
2013 $ 17.0 $ 2.2
Revenue Profit