GE 2014 Annual Report Download - page 231
Download and view the complete annual report
Please find page 231 of the 2014 GE annual report below. You can navigate through the pages in the report by either clicking on the pages listed below, or by using the keyword search tool below to find specific information within the annual report.-
 1
1 -
2
-
3
-
4
-
5
-
6
-
7
-
8
-
9
-
10
-
11
-
12
-
13
-
14
-
15
-
16
-
17
-
18
-
19
-
20
-
21
-
22
-
23
-
24
-
25
-
26
-
27
-
28
-
29
-
30
-
31
-
32
-
33
-
34
-
35
-
36
-
37
-
38
-
39
-
40
-
41
-
42
-
43
-
44
-
45
-
46
-
47
-
48
-
49
-
50
-
51
-
52
-
53
-
54
-
55
-
56
-
57
-
58
-
59
-
60
-
61
-
62
-
63
-
64
-
65
-
66
-
67
-
68
-
69
-
70
-
71
-
72
-
73
-
74
-
75
-
76
-
77
-
78
-
79
-
80
-
81
-
82
-
83
-
84
-
85
-
86
-
87
-
88
-
89
-
90
-
91
-
92
-
93
-
94
-
95
-
96
-
97
-
98
-
99
-
100
-
101
-
102
-
103
-
104
-
105
-
106
-
107
-
108
-
109
-
110
-
111
-
112
-
113
-
114
-
115
-
116
-
117
-
118
-
119
-
120
-
121
-
122
-
123
-
124
-
125
-
126
-
127
-
128
-
129
-
130
-
131
-
132
-
133
-
134
-
135
-
136
-
137
-
138
-
139
-
140
-
141
-
142
-
143
-
144
-
145
-
146
-
147
-
148
-
149
-
150
-
151
-
152
-
153
-
154
-
155
-
156
-
157
-
158
-
159
-
160
-
161
-
162
-
163
-
164
-
165
-
166
-
167
-
168
-
169
-
170
-
171
-
172
-
173
-
174
-
175
-
176
-
177
-
178
-
179
-
180
-
181
-
182
-
183
-
184
-
185
-
186
-
187
-
188
-
189
-
190
-
191
-
192
-
193
-
194
-
195
-
196
-
197
-
198
-
199
-
200
-
201
-
202
-
203
-
204
-
205
-
206
-
207
-
208
-
209
-
210
-
211
-
212
-
213
-
214
-
215
-
216
-
217
-
218
-
219
-
220
-
 221
221 -
 222
222 -
 223
223 -
 224
224 -
 225
225 -
 226
226 -
 227
227 -
 228
228 -
 229
229 -
 230
230 -
 231
231 -
 232
232 -
 233
233 -
 234
234 -
 235
235 -
 236
236 -
 237
237 -
 238
238 -
 239
239 -
 240
240 -
 241
241 -
242
-
243
-
244
-
245
-
246
-
247
-
248
-
249
-
250
-
251
-
252
-
253
-
254
-
255
-
256
 |
 |

GE 2014 FORM 10-K 211
FINANCIAL STATEMENTS SUPPLEMENTAL CASH FLOWS INFORMATION
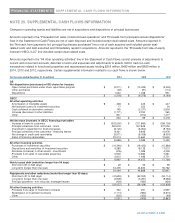
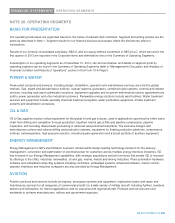
NOTE 25. SUPPLEMENTAL CASH FLOWS INFORMATION
Changes in operating assets and liabilities are net of acquisitions and dispositions of principal businesses.
Amounts reported in the “Proceeds from sales of discontinued operations” and “Proceeds from principal business dispositions”
lines in the Statement of Cash Flows are net of cash disposed and included certain deal-related costs. Amounts reported in
the “Net cash from (payments for) principal businesses purchased” line is net of cash acquired and included certain deal-
related costs and debt assumed and immediately repaid in acquisitions. Amounts reported in the “Proceeds from sale of equity
interest in NBCU LLC” line included certain deal-related costs.
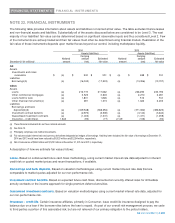
Amounts reported in the “All other operating activities” line in the Statement of Cash Flows consist primarily of adjustments to
current and noncurrent accruals, deferrals of costs and expenses and adjustments to assets. GECC had non-cash
transactions related to foreclosed properties and repossessed assets totaling $218 million, $482 million and $839 million in
2014, 2013 and 2012, respectively. Certain supplemental information related to our cash flows is shown below.
For the years ended December 31 (In millions) 2014 2013 2012
GE
Net dis
p
ositions (
p
urchases) of GE shares for treasur
y
O
p
en market
p
urchases under share re
p
urchase
p
ro
g
ram $
(
2,211
)
$
(
10,225
)
$
(
5,005
)
Other
p
urchases
(
49
)
(
91
)
(
110
)
Dis
p
ositions 1,042 1,038 951
$
(
1
,
218
)
$
(
9
,
278
)
$
(
4
,
164
)
GECC
All other o
p
eratin
g
activities
Amortization of intan
g
ible assets $ 408 $ 425 $ 447
Net realized losses on investment securities 17 523 34
Cash collateral on derivative contracts 745
(
2,271
)
2,900
Increase
(
decrease
)
in other liabilities
(
1,771
)
2,334 560
Other 841
(
912
)
1,477
$ 240 $ 99 $ 5
,
418
Net decrease
(
increase
)
in GECC financin
g
receivables
Increase in loans to customers $
(
323,050
)
$
(
311,860
)
$
(
308,156
)
Princi
p
al collections from customers - loans 302,618 307,849 307,250
Investment in e
q
ui
p
ment for financin
g
leases
(
8,120
)
(
8,652
)
(
9,192
)
Princi
p
al collections from customers - financin
g
leases 8,421 9,646 10,976
Net chan
g
e in credit card receivables
(
5,571
)
(
8,058
)
(
8,030
)
Sales of financin
g
receivables 20,013 14,664 12,642
$
(
5
,
689
)
$ 3
,
589 $ 5
,
490
All other investin
g
activities
Purchases of investment securities $
(
10,346
)
$
(
16,422
)
$
(
15,666
)
Dis
p
ositions and maturities of investment securities 9,289 18,139 17,010
Decrease
(
increase
)
in other assets - investments
(
476
)
1,089 4,338
Proceeds from sales of real estate
p
ro
p
erties 5,920 10,680 3,381
Other 2,610 1,486 2,731
$ 6
,
997 $ 14
,
972 $ 11
,
794
Newl
y
issued debt
(
maturities lon
g
er than 90 da
y
s
)
Short-term
(
91 to 365 da
y
s
)
$ 29 $ 55 $ 59
Lon
g
-term
(
lon
g
er than one
y
ear
)
34,435 44,833 55,782
$ 34
,
464 $ 44
,
888 $ 55
,
841
Re
p
a
y
ments and other reductions
(
maturities lon
g
er than 90 da
y
s
)
Short-term
(
91 to 365 da
y
s
)
$
(
47,694
)
$
(
52,553
)
$
(
94,114
)
Lon
g
-term
(
lon
g
er than one
y
ear
)
(
4,909
)
(
3,291
)
(
9,368
)
Princi
p
al
p
a
y
ments - non-recourse, levera
g
ed leases
(
454
)
(
585
)
(
426
)
$
(
53
,
057
)
$
(
56
,
429
)
$
(
103
,
908
)
All other financin
g
activities
Proceeds from sales of investment contracts $ 322 $ 491 $ 2,697
Redem
p
tion of investment contracts
(
1,113
)
(
980
)
(
5,515
)
Other
(
300
)
(
420
)
(
49
)
$
(
1
,
091
)
$
(
909
)
$
(
2
,
867
)