GE 2014 Annual Report Download - page 101
Download and view the complete annual report
Please find page 101 of the 2014 GE annual report below. You can navigate through the pages in the report by either clicking on the pages listed below, or by using the keyword search tool below to find specific information within the annual report.-
 1
1 -
2
-
3
-
4
-
5
-
6
-
7
-
8
-
9
-
10
-
11
-
12
-
13
-
14
-
15
-
16
-
17
-
18
-
19
-
20
-
21
-
22
-
23
-
24
-
25
-
26
-
27
-
28
-
29
-
30
-
31
-
32
-
33
-
34
-
35
-
36
-
37
-
38
-
39
-
40
-
41
-
42
-
43
-
44
-
45
-
46
-
47
-
48
-
49
-
50
-
51
-
52
-
53
-
54
-
55
-
56
-
57
-
58
-
59
-
60
-
61
-
62
-
63
-
64
-
65
-
66
-
67
-
68
-
69
-
70
-
71
-
72
-
73
-
74
-
75
-
76
-
77
-
78
-
79
-
80
-
81
-
82
-
83
-
84
-
85
-
86
-
87
-
88
-
89
-
90
-
 91
91 -
 92
92 -
 93
93 -
 94
94 -
 95
95 -
 96
96 -
 97
97 -
 98
98 -
 99
99 -
 100
100 -
 101
101 -
 102
102 -
 103
103 -
 104
104 -
 105
105 -
 106
106 -
 107
107 -
 108
108 -
 109
109 -
 110
110 -
 111
111 -
112
-
113
-
114
-
115
-
116
-
117
-
118
-
119
-
120
-
121
-
122
-
123
-
124
-
125
-
126
-
127
-
128
-
129
-
130
-
131
-
132
-
133
-
134
-
135
-
136
-
137
-
138
-
139
-
140
-
141
-
142
-
143
-
144
-
145
-
146
-
147
-
148
-
149
-
150
-
151
-
152
-
153
-
154
-
155
-
156
-
157
-
158
-
159
-
160
-
161
-
162
-
163
-
164
-
165
-
166
-
167
-
168
-
169
-
170
-
171
-
172
-
173
-
174
-
175
-
176
-
177
-
178
-
179
-
180
-
181
-
182
-
183
-
184
-
185
-
186
-
187
-
188
-
189
-
190
-
191
-
192
-
193
-
194
-
195
-
196
-
197
-
198
-
199
-
200
-
201
-
202
-
203
-
204
-
205
-
206
-
207
-
208
-
209
-
210
-
211
-
212
-
213
-
214
-
215
-
216
-
217
-
218
-
219
-
220
-
221
-
222
-
223
-
224
-
225
-
226
-
227
-
228
-
229
-
230
-
231
-
232
-
233
-
234
-
235
-
236
-
237
-
238
-
239
-
240
-
241
-
242
-
243
-
244
-
245
-
246
-
247
-
248
-
249
-
250
-
251
-
252
-
253
-
254
-
255
-
256
 |
 |

GE 2014 FORM 10-K 81
MD&A FINANCIAL RESOURCES AND LIQUIDITY
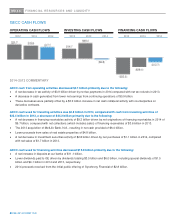
2013–2012 COMMENTARY
GECC cash from operating activities decreased $1.9 billion primarily due to the following:
x A decrease in net cash collateral activity with counterparties on derivative contracts of $5.2 billion.
x This decrease was partially offset by an increase in net tax activity of $2.5 billion driven by net tax refunds in 2013,
compared with net tax payments in 2012 and increased cash generated from higher net earnings from continuing
operations of $0.9 billion.
GECC cash from investing activities increased $8.7 billion primarily due to the following:
x Higher proceeds from sales of real estate properties of $7.3 billion.
x The 2013 acquisition of MetLife Bank, N.A., resulting in net cash provided of $6.4 billion.
x Lower net loan repayments from our equity method investments of $4.9 billion.
x Lower collections (which includes sales) exceeding originations of financing receivables of $1.9 billion.
GECC cash used for financing activities decreased $23.0 billion primarily due to the following:
x Lower net repayments of borrowings, consisting primarily of net reductions in long-term borrowings and commercial paper
of $24.0 billion.
x Lower redemptions of guaranteed investment contracts of $2.3 billion.
x Beginning in the second quarter of 2012, GECC restarted its dividend to GE. GECC paid dividends totaling $6.0 billion
and $6.4 billion to GE, including special dividends of $4.1 billion and $4.5 billion in 2013 and 2012, respectively.
x These decreases were partially offset by lower proceeds from the issuance of preferred stock of $3.0 billion.
INTERCOMPANY TRANSACTIONS AND ELIMINATIONS
Effects of transactions between related companies are made on an arms-length basis, are eliminated and consist primarily of
GECC dividends to GE; GE customer receivables sold to GECC; GECC services for trade receivables management and
material procurement; buildings and equipment (including automobiles) leased between GE and GECC; information
technology (IT) and other services sold to GECC by GE; aircraft engines manufactured by GE that are installed on aircraft
purchased by GECC from third-party producers for lease to others; and various investments, loans and allocations of GE
corporate overhead costs.
GE sells customer receivables to GECC in part to fund the growth of our industrial businesses. These transactions can result
in cash generation or cash use. During any given period, GE receives cash from the sale of receivables to GECC. It also
foregoes collection of cash on receivables sold. The incremental amount of cash received from sales of receivables in excess
of the cash GE would have otherwise collected had those receivables not been sold, represents the cash generated or used in
the period relating to this activity. The incremental cash generated in GE CFOA from selling these receivables to GECC
increased GE’s CFOA by $2.2 billion, $0.1 billion and $1.9 billion in 2014, 2013 and 2012, respectively.
See Note 26 to the consolidated financial statements in this Form 10-K Report for additional information about the eliminations
of intercompany transactions between GE and GECC.