GE 2014 Annual Report Download - page 233
Download and view the complete annual report
Please find page 233 of the 2014 GE annual report below. You can navigate through the pages in the report by either clicking on the pages listed below, or by using the keyword search tool below to find specific information within the annual report.-
 1
1 -
2
-
3
-
4
-
5
-
6
-
7
-
8
-
9
-
10
-
11
-
12
-
13
-
14
-
15
-
16
-
17
-
18
-
19
-
20
-
21
-
22
-
23
-
24
-
25
-
26
-
27
-
28
-
29
-
30
-
31
-
32
-
33
-
34
-
35
-
36
-
37
-
38
-
39
-
40
-
41
-
42
-
43
-
44
-
45
-
46
-
47
-
48
-
49
-
50
-
51
-
52
-
53
-
54
-
55
-
56
-
57
-
58
-
59
-
60
-
61
-
62
-
63
-
64
-
65
-
66
-
67
-
68
-
69
-
70
-
71
-
72
-
73
-
74
-
75
-
76
-
77
-
78
-
79
-
80
-
81
-
82
-
83
-
84
-
85
-
86
-
87
-
88
-
89
-
90
-
91
-
92
-
93
-
94
-
95
-
96
-
97
-
98
-
99
-
100
-
101
-
102
-
103
-
104
-
105
-
106
-
107
-
108
-
109
-
110
-
111
-
112
-
113
-
114
-
115
-
116
-
117
-
118
-
119
-
120
-
121
-
122
-
123
-
124
-
125
-
126
-
127
-
128
-
129
-
130
-
131
-
132
-
133
-
134
-
135
-
136
-
137
-
138
-
139
-
140
-
141
-
142
-
143
-
144
-
145
-
146
-
147
-
148
-
149
-
150
-
151
-
152
-
153
-
154
-
155
-
156
-
157
-
158
-
159
-
160
-
161
-
162
-
163
-
164
-
165
-
166
-
167
-
168
-
169
-
170
-
171
-
172
-
173
-
174
-
175
-
176
-
177
-
178
-
179
-
180
-
181
-
182
-
183
-
184
-
185
-
186
-
187
-
188
-
189
-
190
-
191
-
192
-
193
-
194
-
195
-
196
-
197
-
198
-
199
-
200
-
201
-
202
-
203
-
204
-
205
-
206
-
207
-
208
-
209
-
210
-
211
-
212
-
213
-
214
-
215
-
216
-
217
-
218
-
219
-
220
-
221
-
222
-
 223
223 -
 224
224 -
 225
225 -
 226
226 -
 227
227 -
 228
228 -
 229
229 -
 230
230 -
 231
231 -
 232
232 -
 233
233 -
 234
234 -
 235
235 -
 236
236 -
 237
237 -
 238
238 -
 239
239 -
 240
240 -
 241
241 -
 242
242 -
 243
243 -
244
-
245
-
246
-
247
-
248
-
249
-
250
-
251
-
252
-
253
-
254
-
255
-
256
 |
 |

GE 2014 FORM 10-K 213
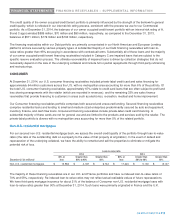
FINANCIAL STATEMENTS FINANCING RECEIVABLES – SUPPLEMENTAL INFORMATION
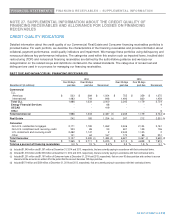
NOTE 27. SUPPLEMENTAL INFORMATION ABOUT THE CREDIT QUALITY OF
FINANCING RECEIVABLES AND ALLOWANCE FOR LOSSES ON FINANCING
RECEIVABLES
CREDIT QUALITY INDICATORS
Detailed information about the credit quality of our Commercial, Real Estate and Consumer financing receivables portfolios is
provided below. For each portfolio, we describe the characteristics of the financing receivables and provide information about
collateral, payment performance, credit quality indicators and impairment. We manage these portfolios using delinquency and
nonaccrual data as key performance indicators. The categories used within this section such as impaired loans, troubled debt
restructuring (TDR) and nonaccrual financing receivables are defined by the authoritative guidance and we base our
categorization on the related scope and definitions contained in the related standards. The categories of nonaccrual and
delinquent are used in our process for managing our financing receivables.
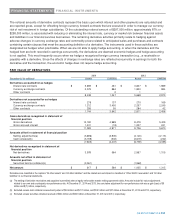
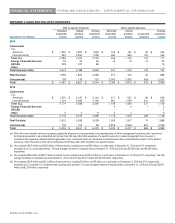
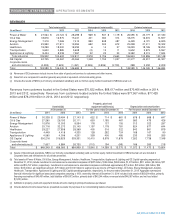
PAST DUE AND NONACCRUAL FINANCING RECEIVABLES
2014 2013
Over 30 days Over 90 days Over 30 days Over 90 days
December 31 (In millions) past due past due Nonaccrual past due past due Nonaccrual
Commercial
CLL
Americas $ 503 $ 284
$ 1,054
$ 755
$ 359
$ 1,275
International 1,483
749
946
1,490
820
1,459
Total CLL 1,986
1,033
2,000
2,245
1,179 2,734
Energy Financial Services -
- 68
-
- 4
GECAS -
- 419
-
- -
Other -
- -
-
- 6
Total Commercial 1,986
1,033
2,487 (a) 2,245
1,179 2,744
(a)
Real Estate 242
183
1,254 (b) 247
212 2,551
(b)
Consumer
Non-U.S. residential mortgages 2,171
1,195
1,262
3,406
2,104
2,161
Non-U.S. installment and revolving credit 333
89 53
601
159
106
U.S. installment and revolving credit 2,492
1,147
2
2,442
1,105
2
Other 141
64 167
172
99 351
Total Consumer 5,137
2,495
(c) 1,484
(d) 6,621
3,467 (c) 2,620
(d)
Total $ 7,365
$ 3,711
$ 5,225
$ 9,113 $ 4,858
$ 7,915
Total as a percent of financing receivables 3.0 % 1.5 % 2.2
% 3.5 % 1.9 % 3.1 %
(a) Included $1,549 million and $1,397 million at December 31, 2014 and 2013, respectively, that are currently paying in accordance with their contractual terms.
(b) Included $1,018 million and $2,308 million at December 31, 2014 and 2013, respectively, that are currently paying in accordance with their contractual terms.
(c) Included $1,231 million and $1,197 million of Consumer loans at December 31, 2014 and 2013, respectively, that are over 90 days past due and continue to accrue
interest until the accounts are written off in the period that the account becomes 180 days past due.
(d) Included $179 million and $324 million at December 31, 2014 and 2013, respectively, that are currently paying in accordance with their contractual terms.