GE 2014 Annual Report Download - page 122
Download and view the complete annual report
Please find page 122 of the 2014 GE annual report below. You can navigate through the pages in the report by either clicking on the pages listed below, or by using the keyword search tool below to find specific information within the annual report.-
 1
1 -
2
-
3
-
4
-
5
-
6
-
7
-
8
-
9
-
10
-
11
-
12
-
13
-
14
-
15
-
16
-
17
-
18
-
19
-
20
-
21
-
22
-
23
-
24
-
25
-
26
-
27
-
28
-
29
-
30
-
31
-
32
-
33
-
34
-
35
-
36
-
37
-
38
-
39
-
40
-
41
-
42
-
43
-
44
-
45
-
46
-
47
-
48
-
49
-
50
-
51
-
52
-
53
-
54
-
55
-
56
-
57
-
58
-
59
-
60
-
61
-
62
-
63
-
64
-
65
-
66
-
67
-
68
-
69
-
70
-
71
-
72
-
73
-
74
-
75
-
76
-
77
-
78
-
79
-
80
-
81
-
82
-
83
-
84
-
85
-
86
-
87
-
88
-
89
-
90
-
91
-
92
-
93
-
94
-
95
-
96
-
97
-
98
-
99
-
100
-
101
-
102
-
103
-
104
-
105
-
106
-
107
-
108
-
109
-
110
-
111
-
 112
112 -
 113
113 -
 114
114 -
 115
115 -
 116
116 -
 117
117 -
 118
118 -
 119
119 -
 120
120 -
 121
121 -
 122
122 -
 123
123 -
 124
124 -
 125
125 -
 126
126 -
 127
127 -
 128
128 -
 129
129 -
 130
130 -
 131
131 -
 132
132 -
133
-
134
-
135
-
136
-
137
-
138
-
139
-
140
-
141
-
142
-
143
-
144
-
145
-
146
-
147
-
148
-
149
-
150
-
151
-
152
-
153
-
154
-
155
-
156
-
157
-
158
-
159
-
160
-
161
-
162
-
163
-
164
-
165
-
166
-
167
-
168
-
169
-
170
-
171
-
172
-
173
-
174
-
175
-
176
-
177
-
178
-
179
-
180
-
181
-
182
-
183
-
184
-
185
-
186
-
187
-
188
-
189
-
190
-
191
-
192
-
193
-
194
-
195
-
196
-
197
-
198
-
199
-
200
-
201
-
202
-
203
-
204
-
205
-
206
-
207
-
208
-
209
-
210
-
211
-
212
-
213
-
214
-
215
-
216
-
217
-
218
-
219
-
220
-
221
-
222
-
223
-
224
-
225
-
226
-
227
-
228
-
229
-
230
-
231
-
232
-
233
-
234
-
235
-
236
-
237
-
238
-
239
-
240
-
241
-
242
-
243
-
244
-
245
-
246
-
247
-
248
-
249
-
250
-
251
-
252
-
253
-
254
-
255
-
256
 |
 |

102 GE 2014 FORM 10-K
MD&A SUPPLEMENTAL INFORMATION
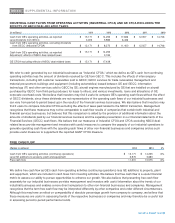
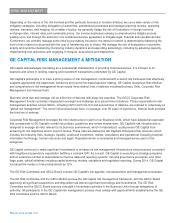
GE CAPITAL ENDING NET INVESTMENT (ENI), EXCLUDING LIQUIDITY
December 31 (In billions) 2014 2013 2008(a)
Financial Services (GECC) total assets $ 494.0 $ 512.0 $ 661.0
Ad
j
ustment: deferred income taxes 6.2 4.8 -
GECC total assets 500.2 516.8 661.0
Less assets of discontinued o
p
erations 1.2 2.3 25.1
Less non-interest bearin
g
liabilities 60.5 59.3 85.4
GE Ca
p
ital ENI 438.5 455.2 550.5
Less li
q
uidit
y(
b
)
75.5 74.9 37.7
GE Ca
p
ital ENI
,
excludin
g
li
q
uidit
y
$ 363.0 $ 380.3 $ 512.8
(a) As of January 1, 2009, as originally reported.
(b) Liquidity includes cash and equivalents and $1.2 billion of debt obligations of the U.S. Treasury at December 31, 2014.
We use ENI to measure the size of our GE Capital segment. We believe that this measure is a useful indicator of the capital
(debt or equity) required to fund a business as it adjusts for non-interest bearing current liabilities generated in the normal
course of business that do not require a capital outlay. We also believe that by excluding liquidity, we provide a meaningful
measure of assets requiring capital to fund our GE Capital segment as a substantial amount of liquidity resulted from debt
issuances to pre-fund future debt maturities and will not be used to fund additional assets. Liquidity consists of cash and
equivalents and certain debt obligations of the U.S. Treasury. As a general matter, investments included in liquidity are
expected to be highly liquid, giving us the ability to readily convert them to cash. Providing this measure will help investors
measure how we are performing against our previously communicated goal to reduce the size of our financial services
segment. We also believe that presenting our 2008 ENI provides investors with information to better understand the progress
we have made toward the goal of making GECC a smaller, more focused finance company.
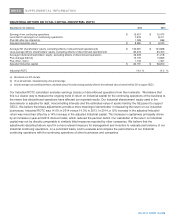
GECC TIER 1 COMMON RATIO ESTIMATE(a)
December 31 (In billions) 2014 2013 2008
Shareowners' equity(b) $ 87.5 $ 82.7 $ 53.3
Adjustments:
Preferred equity (4.9) (4.9) -
Goodwill and other intangible assets (26.3) (27.4) (29.0)
Unrealized gain (loss) on investments and hedges (0.3) - 6.2
Other additions (deductions) (0.5) (0.3) (0.8)
GECC Tier 1 common 55.5 50.1 29.7
Estimated risk-weighted assets(c) 438.1 447.2 632.9
GECC Tier 1 common ratio estimate 12.7% 11.2% 4.7%
(a) Includes discontinued operations for all periods.
(b) Total equity excluding noncontrolling interests.
(c) Based on Basel 1 risk-weighted assets estimates.
The GECC Tier 1 common ratio estimate is the ratio of Tier 1 common equity to total risk-weighted assets as calculated based
on our interpretation of the U.S. Basel I capital rules. We are not required by regulators to disclose this capital ratio, and
therefore this capital ratio is considered a non-GAAP financial measure. We believe that this capital ratio is a useful measure
to investors because it is widely used by analysts and regulators to assess the capital position of financial services companies.
GECC’s Tier 1 common ratio estimate is not a Basel I defined regulatory capital ratio and may not be comparable to similarly
titled measures reported by other companies.