GE 2014 Annual Report Download - page 116
Download and view the complete annual report
Please find page 116 of the 2014 GE annual report below. You can navigate through the pages in the report by either clicking on the pages listed below, or by using the keyword search tool below to find specific information within the annual report.-
 1
1 -
2
-
3
-
4
-
5
-
6
-
7
-
8
-
9
-
10
-
11
-
12
-
13
-
14
-
15
-
16
-
17
-
18
-
19
-
20
-
21
-
22
-
23
-
24
-
25
-
26
-
27
-
28
-
29
-
30
-
31
-
32
-
33
-
34
-
35
-
36
-
37
-
38
-
39
-
40
-
41
-
42
-
43
-
44
-
45
-
46
-
47
-
48
-
49
-
50
-
51
-
52
-
53
-
54
-
55
-
56
-
57
-
58
-
59
-
60
-
61
-
62
-
63
-
64
-
65
-
66
-
67
-
68
-
69
-
70
-
71
-
72
-
73
-
74
-
75
-
76
-
77
-
78
-
79
-
80
-
81
-
82
-
83
-
84
-
85
-
86
-
87
-
88
-
89
-
90
-
91
-
92
-
93
-
94
-
95
-
96
-
97
-
98
-
99
-
100
-
101
-
102
-
103
-
104
-
105
-
 106
106 -
 107
107 -
 108
108 -
 109
109 -
 110
110 -
 111
111 -
 112
112 -
 113
113 -
 114
114 -
 115
115 -
 116
116 -
 117
117 -
 118
118 -
 119
119 -
 120
120 -
 121
121 -
 122
122 -
 123
123 -
 124
124 -
 125
125 -
 126
126 -
127
-
128
-
129
-
130
-
131
-
132
-
133
-
134
-
135
-
136
-
137
-
138
-
139
-
140
-
141
-
142
-
143
-
144
-
145
-
146
-
147
-
148
-
149
-
150
-
151
-
152
-
153
-
154
-
155
-
156
-
157
-
158
-
159
-
160
-
161
-
162
-
163
-
164
-
165
-
166
-
167
-
168
-
169
-
170
-
171
-
172
-
173
-
174
-
175
-
176
-
177
-
178
-
179
-
180
-
181
-
182
-
183
-
184
-
185
-
186
-
187
-
188
-
189
-
190
-
191
-
192
-
193
-
194
-
195
-
196
-
197
-
198
-
199
-
200
-
201
-
202
-
203
-
204
-
205
-
206
-
207
-
208
-
209
-
210
-
211
-
212
-
213
-
214
-
215
-
216
-
217
-
218
-
219
-
220
-
221
-
222
-
223
-
224
-
225
-
226
-
227
-
228
-
229
-
230
-
231
-
232
-
233
-
234
-
235
-
236
-
237
-
238
-
239
-
240
-
241
-
242
-
243
-
244
-
245
-
246
-
247
-
248
-
249
-
250
-
251
-
252
-
253
-
254
-
255
-
256
 |
 |

96 GE 2014 FORM 10-K
MD&A SUPPLEMENTAL INFORMATION
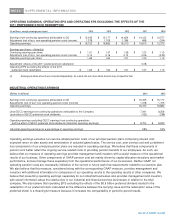
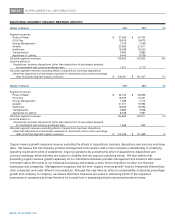
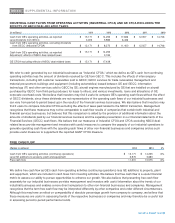
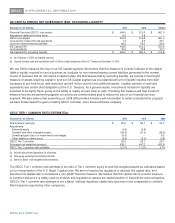
INDUSTRIAL SEGMENT ORGANIC REVENUE GROWTH
(Dollars in millions) 2014 2013 V%
Segment revenues:
Power & Water $ 27,564 $ 24,724
Oil & Gas 18,676 16,975
Energy Management 7,319 7,569
Aviation 23,990 21,911
Healthcare 18,299 18,200
Transportation 5,650 5,885
Appliances & Lighting 8,404 8,338
Industrial segment revenues 109,902 103,602 6%
Less the effects of:
Acquisitions, business dispositions (other than dispositions of businesses acquired
for investment) and currency exchange rates 1,871 2,175
Industrial segment revenues excluding effects of acquisitions, business dispositions
(other than dispositions of businesses acquired for investment) and currency exchange
rates (Industrial segment organic revenues) $ 108,031 $ 101,427 7%
(Dollars in millions) 2013 2012 V%
Segment revenues:
Power & Water $ 24,724 $ 28,299
Oil & Gas 16,975 15,241
Energy Management 7,569 7,412
Aviation 21,911 19,994
Healthcare 18,200 18,290
Transportation 5,885 5,608
Appliances & Lighting 8,338 7,967
Industrial segment revenues 103,602 102,811 1%
Less the effects of:
Acquisitions, business dispositions (other than dispositions of businesses acquired
for investment) and currency exchange rates 1,566 842
Industrial segment revenues excluding effects of acquisitions, business dispositions
(other than dispositions of businesses acquired for investment) and currency exchange
rates (Industrial segment organic revenues) $ 102,036 $ 101,969 -%
Organic revenue growth measures revenue excluding the effects of acquisitions, business dispositions and currency exchange
rates. We believe that this measure provides management and investors with a more complete understanding of underlying
operating results and trends of established, ongoing operations by excluding the effect of acquisitions, dispositions and
currency exchange, which activities are subject to volatility and can obscure underlying trends. We also believe that
presenting organic revenue growth separately for our industrial businesses provides management and investors with useful
information about the trends of our industrial businesses and enables a more direct comparison to other non-financial
businesses and companies. Management recognizes that the term "organic revenue growth" may be interpreted differently by
other companies and under different circumstances. Although this may have an effect on comparability of absolute percentage
growth from company to company, we believe that these measures are useful in assessing trends of the respective
businesses or companies and may therefore be a useful tool in assessing period-to-period performance trends.