GE 2014 Annual Report Download - page 238
Download and view the complete annual report
Please find page 238 of the 2014 GE annual report below. You can navigate through the pages in the report by either clicking on the pages listed below, or by using the keyword search tool below to find specific information within the annual report.-
 1
1 -
2
-
3
-
4
-
5
-
6
-
7
-
8
-
9
-
10
-
11
-
12
-
13
-
14
-
15
-
16
-
17
-
18
-
19
-
20
-
21
-
22
-
23
-
24
-
25
-
26
-
27
-
28
-
29
-
30
-
31
-
32
-
33
-
34
-
35
-
36
-
37
-
38
-
39
-
40
-
41
-
42
-
43
-
44
-
45
-
46
-
47
-
48
-
49
-
50
-
51
-
52
-
53
-
54
-
55
-
56
-
57
-
58
-
59
-
60
-
61
-
62
-
63
-
64
-
65
-
66
-
67
-
68
-
69
-
70
-
71
-
72
-
73
-
74
-
75
-
76
-
77
-
78
-
79
-
80
-
81
-
82
-
83
-
84
-
85
-
86
-
87
-
88
-
89
-
90
-
91
-
92
-
93
-
94
-
95
-
96
-
97
-
98
-
99
-
100
-
101
-
102
-
103
-
104
-
105
-
106
-
107
-
108
-
109
-
110
-
111
-
112
-
113
-
114
-
115
-
116
-
117
-
118
-
119
-
120
-
121
-
122
-
123
-
124
-
125
-
126
-
127
-
128
-
129
-
130
-
131
-
132
-
133
-
134
-
135
-
136
-
137
-
138
-
139
-
140
-
141
-
142
-
143
-
144
-
145
-
146
-
147
-
148
-
149
-
150
-
151
-
152
-
153
-
154
-
155
-
156
-
157
-
158
-
159
-
160
-
161
-
162
-
163
-
164
-
165
-
166
-
167
-
168
-
169
-
170
-
171
-
172
-
173
-
174
-
175
-
176
-
177
-
178
-
179
-
180
-
181
-
182
-
183
-
184
-
185
-
186
-
187
-
188
-
189
-
190
-
191
-
192
-
193
-
194
-
195
-
196
-
197
-
198
-
199
-
200
-
201
-
202
-
203
-
204
-
205
-
206
-
207
-
208
-
209
-
210
-
211
-
212
-
213
-
214
-
215
-
216
-
217
-
218
-
219
-
220
-
221
-
222
-
223
-
224
-
225
-
226
-
227
-
 228
228 -
 229
229 -
 230
230 -
 231
231 -
 232
232 -
 233
233 -
 234
234 -
 235
235 -
 236
236 -
 237
237 -
 238
238 -
 239
239 -
 240
240 -
 241
241 -
 242
242 -
 243
243 -
 244
244 -
 245
245 -
 246
246 -
 247
247 -
 248
248 -
249
-
250
-
251
-
252
-
253
-
254
-
255
-
256
 |
 |

218 GE 2014 FORM 10-K
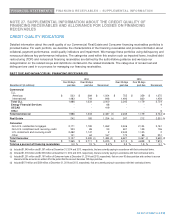
FINANCIAL STATEMENTS FINANCING RECEIVABLES – SUPPLEMENTAL INFORMATION
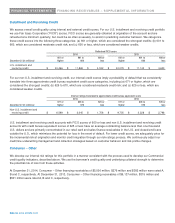
COMMERCIAL FINANCING RECEIVABLES BY RISK CATEGORY
Secured
December 31 (In millions) A B C Total
2014
CLL
Americas $ 63,754 $ 1,549 $ 1,443 $ 66,746
International 41,476 474 891 42,841
Total CLL 105,230 2,023 2,334 109,587
Energy Financial Services 2,479 60 16 2,555
GECAS 7,908 237 118 8,263
Other 130 - - 130
Total $ 115,747 $ 2,320 $ 2,468 $ 120,535
2013
CLL
Americas $ 65,545 $ 1,587 $ 1,554 $ 68,686
International 44,930 619 1,237 46,786
Total CLL 110,475 2,206 2,791 115,472
Energy Financial Services 2,969 9 - 2,978
GECAS 9,175 50 152 9,377
Other 318 - - 318
Total $ 122,937 $ 2,265 $ 2,943 $ 128,145
For our secured financing receivables portfolio, our collateral position and ability to work out problem accounts mitigate our
losses. Our asset managers have deep industry expertise that enables us to identify the optimum approach to default
situations. We price risk premiums for weaker credits at origination, closely monitor changes in creditworthiness through our
risk ratings and watch list process, and are engaged early with deteriorating credits to minimize economic loss. Secured
financing receivables within risk Category C are predominantly in our CLL businesses and are primarily composed of senior
term lending facilities and factoring programs secured by various asset types including inventory, accounts receivable, cash,
equipment and related business facilities as well as franchise finance activities secured by underlying equipment.
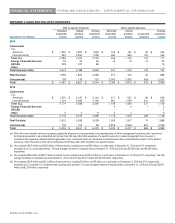
Loans within Category C are reviewed and monitored regularly, and classified as impaired when it is probable that they will not
pay in accordance with contractual terms. Our internal risk rating process identifies credits warranting closer monitoring; and
as such, these loans are not necessarily classified as nonaccrual or impaired.
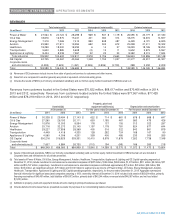
Our unsecured Commercial financing receivables portfolio is primarily attributable to our Interbanca S.p.A. and GE Sanyo
Credit acquisitions in CLL International. At December 31, 2014 and 2013, these financing receivables included $332 million
and $313 million rated A, $408 million and $580 million rated B, and $201 million and $231 million rated C, respectively.
REAL ESTATE
Due to the primarily non-recourse nature of our Debt portfolio, loan-to-value ratios (the ratio of the outstanding debt on a
property to the re-indexed value of that property) provide the best indicators of the credit quality of the portfolio.
Loan-to-value ratio
2014 2013
Less than 80% to Greater than Less than 80% to Greater than
December 31 (In millions) 80% 95% 95% 80% 95% 95%
Debt $ 16,915 $ 1,175 $ 958 $ 15,576 $ 1,300 $ 2,111