GE 2014 Annual Report Download - page 155
Download and view the complete annual report
Please find page 155 of the 2014 GE annual report below. You can navigate through the pages in the report by either clicking on the pages listed below, or by using the keyword search tool below to find specific information within the annual report.-
 1
1 -
2
-
3
-
4
-
5
-
6
-
7
-
8
-
9
-
10
-
11
-
12
-
13
-
14
-
15
-
16
-
17
-
18
-
19
-
20
-
21
-
22
-
23
-
24
-
25
-
26
-
27
-
28
-
29
-
30
-
31
-
32
-
33
-
34
-
35
-
36
-
37
-
38
-
39
-
40
-
41
-
42
-
43
-
44
-
45
-
46
-
47
-
48
-
49
-
50
-
51
-
52
-
53
-
54
-
55
-
56
-
57
-
58
-
59
-
60
-
61
-
62
-
63
-
64
-
65
-
66
-
67
-
68
-
69
-
70
-
71
-
72
-
73
-
74
-
75
-
76
-
77
-
78
-
79
-
80
-
81
-
82
-
83
-
84
-
85
-
86
-
87
-
88
-
89
-
90
-
91
-
92
-
93
-
94
-
95
-
96
-
97
-
98
-
99
-
100
-
101
-
102
-
103
-
104
-
105
-
106
-
107
-
108
-
109
-
110
-
111
-
112
-
113
-
114
-
115
-
116
-
117
-
118
-
119
-
120
-
121
-
122
-
123
-
124
-
125
-
126
-
127
-
128
-
129
-
130
-
131
-
132
-
133
-
134
-
135
-
136
-
137
-
138
-
139
-
140
-
141
-
142
-
143
-
144
-
 145
145 -
 146
146 -
 147
147 -
 148
148 -
 149
149 -
 150
150 -
 151
151 -
 152
152 -
 153
153 -
 154
154 -
 155
155 -
 156
156 -
 157
157 -
 158
158 -
 159
159 -
 160
160 -
 161
161 -
 162
162 -
 163
163 -
 164
164 -
 165
165 -
166
-
167
-
168
-
169
-
170
-
171
-
172
-
173
-
174
-
175
-
176
-
177
-
178
-
179
-
180
-
181
-
182
-
183
-
184
-
185
-
186
-
187
-
188
-
189
-
190
-
191
-
192
-
193
-
194
-
195
-
196
-
197
-
198
-
199
-
200
-
201
-
202
-
203
-
204
-
205
-
206
-
207
-
208
-
209
-
210
-
211
-
212
-
213
-
214
-
215
-
216
-
217
-
218
-
219
-
220
-
221
-
222
-
223
-
224
-
225
-
226
-
227
-
228
-
229
-
230
-
231
-
232
-
233
-
234
-
235
-
236
-
237
-
238
-
239
-
240
-
241
-
242
-
243
-
244
-
245
-
246
-
247
-
248
-
249
-
250
-
251
-
252
-
253
-
254
-
255
-
256
 |
 |

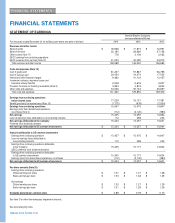
GE 2014 FORM 10-K 135
FINANCIAL STATEMENTS
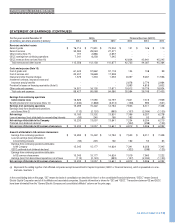
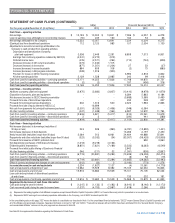
STATEMENT OF CASH FLOWS (CONTINUED)
GE(a) Financial Services (GECC)
For the years ended December 31 (In millions) 2014 2013 2012 2014 2013 2012
Cash flows – operatin
g
activities
Net earnin
g
s $ 15,183 $ 13,302 $ 13,801 $ 7,396 $ 6,257 $ 6,278
Less net earnin
g
s
(
loss
)
attributable to noncontrollin
g
interests (50) 245 160 162 53 63
Net earnin
g
s attributable to the Com
p
an
y
15,233 13,057 13,641 7,234 6,204 6,215
(
Earnin
g
s
)
loss from discontinued operations 112 2,120 983 107 2,054 1,130
A
d
j
ustments to reconcile net earnin
g
s attributable to the
Compan
y
to cash provided from operatin
g
activities
Depreciation and amortization of propert
y
,
plant and equipment 2,508 2,449 2,291 6,859 7,313 6,901
Earnin
g
s from continuin
g
operations retained b
y
GECC
(
b
)
(4,341) (2,273) (919) - - -
Deferred income taxes (476) (2,571) (294) (710) (724) (858)
Decrease
(
increase
)
in GE current receivables (473) (1,432) 1,105 - - -
Decrease
(
increase
)
in inventories (877) (1,351) (1,204) 27 33 (27)
Increase
(
decrease
)
in accounts pa
y
able 884 809 158 (2) 73 (880)
Increase
(
decrease
)
in GE pro
g
ress collections (528) 1,919 (920) - - -
Provision for losses on GECC financin
g
receivables - - - 3,993 4,818 3,832
All other operatin
g
activities 3,129 1,528 2,985 240 99 5,418
Cash from
(
used for
)
o
p
eratin
g
activities – continuin
g
o
p
erations 15,171 14,255 17,826 17,748 19,870 21,731
Cash from
(
used for
)
operatin
g
activities – discontinued operations (2) (2) - 197 (456) 316
Cash from
(
used for
)
o
p
eratin
g
activities 15,169 14,253 17,826 17,945 19,414 22,047
Cash flows – investin
g
activities
A
dditions to propert
y
, plant and equipment (3,970) (3,680) (3,937) (10,410) (9,978) (11,879)
Dispositions of propert
y
, plant and equipment - - - 6,284 5,883 6,184
Net decrease
(
increase
)
in GECC financin
g
receivables - - - (5,689) 3,589 5,490
Proceeds from sale of discontinued operations - - - 232 528 227
Proceeds from principal business dispositions 602 1,316 540 2,320 1,983 2,863
Proceeds from sale of equit
y
interest in NBCU LLC - 16,699 - - - -
Net cash from
(
pa
y
ments for
)
principal businesses purchased (2,091) (8,026) (1,456) (548) 6,384 -
A
ll other investin
g
activities (447) (1,488) (564) 6,997 14,972 11,794
Cash from
(
used for
)
investin
g
activities – continuin
g
o
p
erations
(
5
,
906
)
4
,
821
(
5
,
417
)
(
814
)
23
,
361 14
,
679
Cash from
(
used for
)
investin
g
activities – discontinued operations 2 2 - (290) 441 (288)
Cash from
(
used for
)
investin
g
activities
(
5
,
904
)
4
,
823
(
5
,
417
)
(
1
,
104
)
23
,
802 14
,
391
Cash flows – financing activities
Net increase
(
decrease
)
in borrowin
g
s
(
maturities of
90 da
y
s or less
)
243 949 (890) (6,781) (13,892) (1,401)
Net increase
(
decrease
)
in bank deposits - - - 13,286 2,197 2,450
Newl
y
issued debt
(
maturities lon
g
er than 90 da
y
s
)
3,084 512 6,961 34,464 44,888 55,841
Repa
y
ments and other reductions
(
maturities lon
g
er than 90 da
y
s
)
(323) (5,032) (34) (53,057) (56,429) (103,908)
Proceeds from issuance of GECC preferred stock - - - - 990 3,960
Net dispositions
(
purchases
)
of GE shares for treasur
y
(1,218) (9,278) (4,164) - - -
Dividends paid to shareowners (8,851) (7,821) (7,189) (3,322) (6,283) (6,549)
Proceeds from initial public offerin
g
of S
y
nchron
y
Financial - - - 2,842 - -
A
ll other financin
g
activities 346 (211) 32 (1,091) (909) (2,867)
Cash from
(
used for
)
financin
g
activities – continuin
g
o
p
erations
(
6,719
)
(
20,881
)
(
5,284
)
(
13,659
)
(
29,438
)
(
52,474
)
Cash from
(
used for
)
financin
g
activities – discontinued operations - - - (6) 56 (19)
Cash from
(
used for
)
financin
g
activities
(
6,719
)
(
20,881
)
(
5,284
)
(
13,665
)
(
29,382
)
(
52,493
)
Effect of currenc
y
exchan
g
e rate chan
g
es on cash and e
q
uivalents
(
312
)
(
22
)
2
(
3,180
)
(
773
)
1,276
Increase
(
decrease
)
in cash and e
q
uivalents 2,234
(
1,827
)
7,127
(
4
)
13,061
(
14,779
)
Cash and equivalents at be
g
innin
g
of
y
ear 13,682 15,509 8,382 75,105 62,044 76,823
Cash and e
q
uivalents at end of
y
ear 15,916 13,682 15,509 75,101 75,105 62,044
Less cash and equivalents of discontinued operations
at end of
y
ear - - - 133 232 191
Cash and e
q
uivalents of continuin
g
o
p
erations at end of
y
ear $ 15
,
916 $ 13
,
682 $ 15
,
509 $ 74
,
968 $ 74
,
873 $ 61
,
853
Su
pp
lemental disclosure of cash flows information
Cash paid durin
g
the
y
ear for interest $ (1,215) $ (1,132) $ (1,182) $ (8,910) $ (8,146) $ (12,172)
Cash recovered
(p
aid
)
durin
g
the
y
ear for income taxes
(
1
,
337
)
(
4
,
753
)
(
2
,
987
)
(
1
,
618
)
2
,
266
(
250
)
(a) Represents the adding together of all affiliated companies except General Electric Capital Corporation (GECC or Financial Services), which is presented on a one-line basis.
(b) Represents GECC earnings from continuing operations attributable to the Company, net of GECC dividends paid to GE.
In the consolidating data on this page, "GE" means the basis of consolidation as described in Note 1 to the consolidated financial statements; "GECC" means General Electric Capital Corporation and
all of its affiliates and associated companies. Separate information is shown for “GE” and “GECC.” Transactions between GE and GECC have been eliminated from the “General Electric Company
and consolidated affiliates” columns on the prior page and are discussed in Note 26.
See Note 25 for supplemental information regarding the Statement of Cash Flows