GE 2014 Annual Report Download - page 240
Download and view the complete annual report
Please find page 240 of the 2014 GE annual report below. You can navigate through the pages in the report by either clicking on the pages listed below, or by using the keyword search tool below to find specific information within the annual report.-
 1
1 -
2
-
3
-
4
-
5
-
6
-
7
-
8
-
9
-
10
-
11
-
12
-
13
-
14
-
15
-
16
-
17
-
18
-
19
-
20
-
21
-
22
-
23
-
24
-
25
-
26
-
27
-
28
-
29
-
30
-
31
-
32
-
33
-
34
-
35
-
36
-
37
-
38
-
39
-
40
-
41
-
42
-
43
-
44
-
45
-
46
-
47
-
48
-
49
-
50
-
51
-
52
-
53
-
54
-
55
-
56
-
57
-
58
-
59
-
60
-
61
-
62
-
63
-
64
-
65
-
66
-
67
-
68
-
69
-
70
-
71
-
72
-
73
-
74
-
75
-
76
-
77
-
78
-
79
-
80
-
81
-
82
-
83
-
84
-
85
-
86
-
87
-
88
-
89
-
90
-
91
-
92
-
93
-
94
-
95
-
96
-
97
-
98
-
99
-
100
-
101
-
102
-
103
-
104
-
105
-
106
-
107
-
108
-
109
-
110
-
111
-
112
-
113
-
114
-
115
-
116
-
117
-
118
-
119
-
120
-
121
-
122
-
123
-
124
-
125
-
126
-
127
-
128
-
129
-
130
-
131
-
132
-
133
-
134
-
135
-
136
-
137
-
138
-
139
-
140
-
141
-
142
-
143
-
144
-
145
-
146
-
147
-
148
-
149
-
150
-
151
-
152
-
153
-
154
-
155
-
156
-
157
-
158
-
159
-
160
-
161
-
162
-
163
-
164
-
165
-
166
-
167
-
168
-
169
-
170
-
171
-
172
-
173
-
174
-
175
-
176
-
177
-
178
-
179
-
180
-
181
-
182
-
183
-
184
-
185
-
186
-
187
-
188
-
189
-
190
-
191
-
192
-
193
-
194
-
195
-
196
-
197
-
198
-
199
-
200
-
201
-
202
-
203
-
204
-
205
-
206
-
207
-
208
-
209
-
210
-
211
-
212
-
213
-
214
-
215
-
216
-
217
-
218
-
219
-
220
-
221
-
222
-
223
-
224
-
225
-
226
-
227
-
228
-
229
-
 230
230 -
 231
231 -
 232
232 -
 233
233 -
 234
234 -
 235
235 -
 236
236 -
 237
237 -
 238
238 -
 239
239 -
 240
240 -
 241
241 -
 242
242 -
 243
243 -
 244
244 -
 245
245 -
 246
246 -
 247
247 -
 248
248 -
 249
249 -
 250
250 -
251
-
252
-
253
-
254
-
255
-
256
 |
 |

220 GE 2014 FORM 10-K
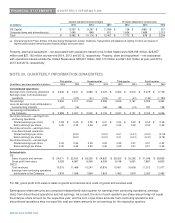
FINANCIAL STATEMENTS FINANCING RECEIVABLES – SUPPLEMENTAL INFORMATION
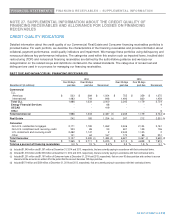
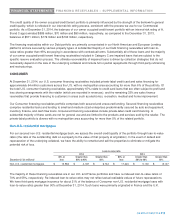
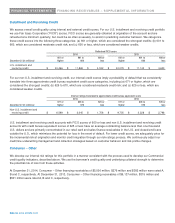
Installment and Revolving Credit
We assess overall credit quality using internal and external credit scores. For our U.S. installment and revolving credit portfolio
we use Fair Isaac Corporation (“FICO”) scores. FICO scores are generally obtained at origination of the account and are
refreshed at a minimum quarterly, but could be as often as weekly, to assist in predicting customer behavior. We categorize
these credit scores into the following three categories; (a) 661 or higher, which are considered the strongest credits; (b) 601 to
660, which are considered moderate credit risk; and (c) 600 or less, which are considered weaker credits.
Refreshed FICO score
2014 2013
661 o
r
601 to 600 o
r
661 o
r
601 to 600 o
r
December 31 (In millions) highe
r
660 less highe
r
660 less
U.S. installment and
revolving credit $ 43,466 $ 11,865 $ 4,532 $ 40,079 $ 11,142 $ 4,633
For our non-U.S. installment and revolving credit, our internal credit scores imply a probability of default that we consistently
translate into three approximate credit bureau equivalent credit score categories, including (a) 671 or higher, which are
considered the strongest credits; (b) 626 to 670, which are considered moderate credit risk; and (c) 625 or less, which are
considered weaker credits.
Internal ratings translated to approximate credit bureau equivalent score
2014 2013
671 o
r
626 to 625 o
r
671 o
r
626 to 625 o
r
December 31 (In millions) highe
r
670 less highe
r
670 less
Non-U.S. installment and
revolving credit $ 6,599 $ 2,045 $ 1,756 $ 9,705 $ 3,228 $ 2,798
U.S. installment and revolving credit accounts with FICO scores of 600 or less and non U.S. installment and revolving credit
accounts with credit bureau equivalent scores of 625 or less have an average outstanding balance less than one thousand
U.S. dollars and are primarily concentrated in our retail card and sales finance receivables in the U.S. and closed-end loans
outside the U.S., which minimizes the potential for loss in the event of default. For lower credit scores, we adequately price for
the incremental risk at origination and monitor credit migration through our risk ratings process. We continuously adjust our
credit line underwriting management and collection strategies based on customer behavior and risk profile changes.
Consumer – Other
We develop our internal risk ratings for this portfolio in a manner consistent with the process used to develop our Commercial
credit quality indicators, described above. We use the borrower’s credit quality and underlying collateral strength to determine
the potential risk of loss from these activities.
At December 31, 2014, Consumer – Other financing receivables of $5,006 million, $276 million and $382 million were rated A,
B and C, respectively. At December 31, 2013, Consumer – Other financing receivables of $6,137 million, $315 million and
$501 million were rated A, B and C, respectively.