GE 2014 Annual Report Download - page 123
Download and view the complete annual report
Please find page 123 of the 2014 GE annual report below. You can navigate through the pages in the report by either clicking on the pages listed below, or by using the keyword search tool below to find specific information within the annual report.-
 1
1 -
2
-
3
-
4
-
5
-
6
-
7
-
8
-
9
-
10
-
11
-
12
-
13
-
14
-
15
-
16
-
17
-
18
-
19
-
20
-
21
-
22
-
23
-
24
-
25
-
26
-
27
-
28
-
29
-
30
-
31
-
32
-
33
-
34
-
35
-
36
-
37
-
38
-
39
-
40
-
41
-
42
-
43
-
44
-
45
-
46
-
47
-
48
-
49
-
50
-
51
-
52
-
53
-
54
-
55
-
56
-
57
-
58
-
59
-
60
-
61
-
62
-
63
-
64
-
65
-
66
-
67
-
68
-
69
-
70
-
71
-
72
-
73
-
74
-
75
-
76
-
77
-
78
-
79
-
80
-
81
-
82
-
83
-
84
-
85
-
86
-
87
-
88
-
89
-
90
-
91
-
92
-
93
-
94
-
95
-
96
-
97
-
98
-
99
-
100
-
101
-
102
-
103
-
104
-
105
-
106
-
107
-
108
-
109
-
110
-
111
-
112
-
 113
113 -
 114
114 -
 115
115 -
 116
116 -
 117
117 -
 118
118 -
 119
119 -
 120
120 -
 121
121 -
 122
122 -
 123
123 -
 124
124 -
 125
125 -
 126
126 -
 127
127 -
 128
128 -
 129
129 -
 130
130 -
 131
131 -
 132
132 -
 133
133 -
134
-
135
-
136
-
137
-
138
-
139
-
140
-
141
-
142
-
143
-
144
-
145
-
146
-
147
-
148
-
149
-
150
-
151
-
152
-
153
-
154
-
155
-
156
-
157
-
158
-
159
-
160
-
161
-
162
-
163
-
164
-
165
-
166
-
167
-
168
-
169
-
170
-
171
-
172
-
173
-
174
-
175
-
176
-
177
-
178
-
179
-
180
-
181
-
182
-
183
-
184
-
185
-
186
-
187
-
188
-
189
-
190
-
191
-
192
-
193
-
194
-
195
-
196
-
197
-
198
-
199
-
200
-
201
-
202
-
203
-
204
-
205
-
206
-
207
-
208
-
209
-
210
-
211
-
212
-
213
-
214
-
215
-
216
-
217
-
218
-
219
-
220
-
221
-
222
-
223
-
224
-
225
-
226
-
227
-
228
-
229
-
230
-
231
-
232
-
233
-
234
-
235
-
236
-
237
-
238
-
239
-
240
-
241
-
242
-
243
-
244
-
245
-
246
-
247
-
248
-
249
-
250
-
251
-
252
-
253
-
254
-
255
-
256
 |
 |

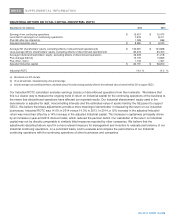
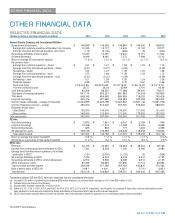
GE 2014 FORM 10-K 103
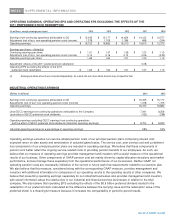
OTHER FINANCIAL DATA
OTHER FINANCIAL DATA
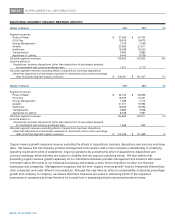
SELECTED FINANCIAL DATA
(Dollars in millions; per-share amounts in dollars) 2014 2013 2012 2011 2010
General Electric Company and Consolidated Affiliates
Revenues and other income $ 148,589 $ 146,045 $ 146,684 $ 146,542 $ 148,875
Earnings from continuing operations attributable to the Company 15,345 15,177 14,624 14,122 12,577
Earnings (loss) from discontinued operations, net of taxes (112) (2,120) (983) 29 (933)
Net earnings attributable to the Company 15,233 13,057 13,641 14,151 11,644
Dividends declared(a) 8,949 8,060 7,372 7,498 5,212
Return on average GE shareowners’ equity(b) 11.6 % 12.2 % 12.1 % 12.1 % 12.3 %
Per common share
Earnings from continuing operations – diluted $ 1.51 $ 1.47 $ 1.38 $ 1.23 $ 1.15
Earnings (loss) from discontinued operations – diluted (0.01) (0.21) (0.09) - (0.09)
Net earnings – diluted 1.50 1.27 1.29 1.23 1.06
Earnings from continuing operations – basic 1.53 1.48 1.39 1.23 1.15
Earnings (loss) from discontinued operations – basic (0.01) (0.21) (0.09) - (0.09)
Net earnings – basic 1.51 1.28 1.29 1.24 1.06
Dividends declared 0.89 0.79 0.70 0.61 0.46
Stock
p
rice ran
g
e 27.94-23.69 28.09-20.68 23.18-18.02 21.65-14.02 19.70-13.75
Year-end closing stock price 25.27 28.03 20.99 17.91 18.29
Cash and equivalents 90,208 88,555 77,268 84,440 78,917
Total assets of continuing operations 647,114 654,221 681,684 714,018 729,895
Total assets 648,349 656,560 684,999 718,003 745,426
Long-term borrowings 200,414 221,665 236,084 243,459 293,323
Common shares outstanding – average (in thousands) 10,044,995 10,222,198 10,522,922 10,591,146 10,661,078
Common shareowner accounts – average 490,000 512,000 537,000 570,000 588,000
Employees at year end(c)
United States 136,000 135,000 134,000 131,000 121,000
Other countries 169,000 172,000 171,000 170,000 152,000
Total employees(c) 305,000 307,000 305,000 301,000 273,000
GE data
Short-term borrowings $ 3,872 $ 1,841 $ 6,041 $ 2,184 $ 456
Long-term borrowings 12,468 11,515 11,428 9,405 9,656
Noncontrolling interests 825 836 777 1,006 4,098
GE shareowners’ equity 128,159 130,566 123,026 116,438 118,936
Total capital invested $ 145,324 $ 144,758 $ 141,272 $ 129,033 $ 133,146
Return on average total capital invested(b)* 10.6 % 11.3 % 11.7 % 11.7 % 12.0 %
Borrowings as a percentage of total capital invested(b) 11.2 % 9.2 % 12.4 % 9.0 % 7.6 %
GECC data
Revenues $ 42,725 $ 44,067 $ 45,364 $ 48,324 $ 49,163
Earnings from continuing operations attributable to GECC 7,341 8,258 7,345 6,480 3,083
Earnings (loss) from discontinued operations, net of taxes,
attributable to GECC (107) (2,054) (1,130) 30 (928)
Net earnings attributable to GECC 7,234 6,204 6,215 6,510 2,155
Net earnings attributable to GECC common shareowner 6,912 5,906 6,092 6,510 2,155
GECC shareowners' equity 87,499 82,694 81,890 77,110 68,984
Total borrowings and bank deposits 349,548 371,062 397,039 442,830 470,363
Ratio of debt to equity at GECC(d)* 3.99:1 4.49:1 4.85:1 5.74:1 6.82:1
Total assets(e) $ 500,216 $ 516,829 $ 539,351 $ 584,643 $ 605,365
Transactions between GE and GECC have been eliminated from the consolidated information.
(a) Included $1,031 million of preferred stock dividends ($806 million related to our preferred stock redemption) in 2011 and $300 million in 2010.
(b) Indicates terms are defined in the Glossary.
(c) Excludes NBC Universal employees of 14,000 in 2010.
(d) Ratios of 3.15:1, 3.58:1, 4.09:1, 4.75:1, and 5.95:1 for 2014, 2013, 2012, 2011 and 2010, respectively, net of liquidity. For purposes of these ratios, cash and debt balances have
been adjusted to include amounts classified as assets and liabilities of businesses held for sale and discontinued operations.
(e) GECC’s total assets excludes deferred income tax liabilities, which are presented as assets for purposes of our consolidating balance sheet presentation.
*Non-GAAP Financial Measure