GE 2014 Annual Report Download - page 194
Download and view the complete annual report
Please find page 194 of the 2014 GE annual report below. You can navigate through the pages in the report by either clicking on the pages listed below, or by using the keyword search tool below to find specific information within the annual report.-
 1
1 -
2
-
3
-
4
-
5
-
6
-
7
-
8
-
9
-
10
-
11
-
12
-
13
-
14
-
15
-
16
-
17
-
18
-
19
-
20
-
21
-
22
-
23
-
24
-
25
-
26
-
27
-
28
-
29
-
30
-
31
-
32
-
33
-
34
-
35
-
36
-
37
-
38
-
39
-
40
-
41
-
42
-
43
-
44
-
45
-
46
-
47
-
48
-
49
-
50
-
51
-
52
-
53
-
54
-
55
-
56
-
57
-
58
-
59
-
60
-
61
-
62
-
63
-
64
-
65
-
66
-
67
-
68
-
69
-
70
-
71
-
72
-
73
-
74
-
75
-
76
-
77
-
78
-
79
-
80
-
81
-
82
-
83
-
84
-
85
-
86
-
87
-
88
-
89
-
90
-
91
-
92
-
93
-
94
-
95
-
96
-
97
-
98
-
99
-
100
-
101
-
102
-
103
-
104
-
105
-
106
-
107
-
108
-
109
-
110
-
111
-
112
-
113
-
114
-
115
-
116
-
117
-
118
-
119
-
120
-
121
-
122
-
123
-
124
-
125
-
126
-
127
-
128
-
129
-
130
-
131
-
132
-
133
-
134
-
135
-
136
-
137
-
138
-
139
-
140
-
141
-
142
-
143
-
144
-
145
-
146
-
147
-
148
-
149
-
150
-
151
-
152
-
153
-
154
-
155
-
156
-
157
-
158
-
159
-
160
-
161
-
162
-
163
-
164
-
165
-
166
-
167
-
168
-
169
-
170
-
171
-
172
-
173
-
174
-
175
-
176
-
177
-
178
-
179
-
180
-
181
-
182
-
183
-
 184
184 -
 185
185 -
 186
186 -
 187
187 -
 188
188 -
 189
189 -
 190
190 -
 191
191 -
 192
192 -
 193
193 -
 194
194 -
 195
195 -
 196
196 -
 197
197 -
 198
198 -
 199
199 -
 200
200 -
 201
201 -
 202
202 -
 203
203 -
 204
204 -
205
-
206
-
207
-
208
-
209
-
210
-
211
-
212
-
213
-
214
-
215
-
216
-
217
-
218
-
219
-
220
-
221
-
222
-
223
-
224
-
225
-
226
-
227
-
228
-
229
-
230
-
231
-
232
-
233
-
234
-
235
-
236
-
237
-
238
-
239
-
240
-
241
-
242
-
243
-
244
-
245
-
246
-
247
-
248
-
249
-
250
-
251
-
252
-
253
-
254
-
255
-
256
 |
 |

174 GE 2014 FORM 10-K
FINANCIAL STATEMENTS POSTRETIREMENT BENEFIT PLANS
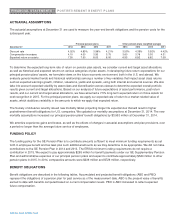
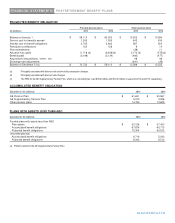
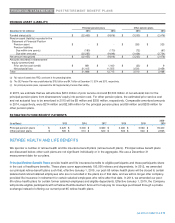
PLAN ASSETS
The fair value of the classes of the pension plans' investments is presented below. The inputs and valuation techniques used
to measure the fair value of the assets are consistently applied and described in Note 1.
FAIR VALUE OF PLAN ASSETS
Principal pension plans Other pension plans
(In millions) 2014 2013 2014 2013
Balance at January 1 $ 48,297 $ 44,738 $ 11,059 $ 9,702
Actual gain on plan assets 2,793 6,312 1,537 1,212
Employer contributions 236 225 726 673
Participant contributions 153 156 9 14
Benefits paid (3,199) (3,134) (493) (477)
Acquisitions (dispositions) / other - net - - - (31)
Exchange rate adjustments - - (452) (34)
Balance at December 31 $ 48,280 $ 48,297 $ 12,386 $ 11,059
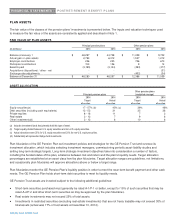
ASSET ALLOCATION
Other pension plans
Principal pension plans (weighted average)
201
4
201
4
2014 201
4
Targe
t
Actual Targe
t
Actual
allocation allocation allocation allocation
Equity securities(a) 17 - 57% (b) 45% (c) 39% 48%
Debt securities (including cash equivalents) 13 - 53 31 35 38
Private equities 8 - 18 11 7 2
Real estate 2 - 12 7 9 6
Other investments(d) 3 - 13 6 10 6
(a) Includes investment funds that primarily hold this type of asset.
(b) Target equally divided between U.S. equity securities and non-U.S. equity securities.
(c) Actual allocations were 25% for U.S. equity securities and 20% for non-U.S. equity securities.
(d) Substantially all represented hedge fund investments.
Plan fiduciaries of the GE Pension Plan set investment policies and strategies for the GE Pension Trust and oversee its
investment allocation, which includes selecting investment managers, commissioning periodic asset-liability studies and
setting long-term strategic targets. Long-term strategic investment objectives take into consideration a number of factors,
including the funded status of the plan, a balance between risk and return and the plan’s liquidity needs. Target allocation
percentages are established at an asset class level by plan fiduciaries. Target allocation ranges are guidelines, not limitations,
and occasionally plan fiduciaries will approve allocations above or below a target range.
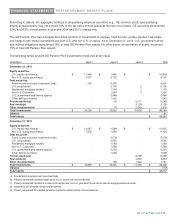
Plan fiduciaries monitor the GE Pension Plan’s liquidity position in order to meet the near-term benefit payment and other cash
needs. The GE Pension Plan holds short-term debt securities to meet its liquidity needs.
GE Pension Trust assets are invested subject to the following additional guidelines:
x Short-term securities purchased must generally be rated A-1/P-1 or better, except for 15% of such securities that may be
rated A-2/P-2 and other short-term securities as may be approved by the plan fiduciaries.
x Real estate investments may not exceed 25% of total assets.
x Investments in restricted securities (excluding real estate investments) that are not freely tradable may not exceed 30% of
total assets (actual was 17% of trust assets at December 31, 2014).