GE 2012 Annual Report Download - page 97
Download and view the complete annual report
Please find page 97 of the 2012 GE annual report below. You can navigate through the pages in the report by either clicking on the pages listed below, or by using the keyword search tool below to find specific information within the annual report.-
 1
1 -
2
-
3
-
4
-
5
-
6
-
7
-
8
-
9
-
10
-
11
-
12
-
13
-
14
-
15
-
16
-
17
-
18
-
19
-
20
-
21
-
22
-
23
-
24
-
25
-
26
-
27
-
28
-
29
-
30
-
31
-
32
-
33
-
34
-
35
-
36
-
37
-
38
-
39
-
40
-
41
-
42
-
43
-
44
-
45
-
46
-
47
-
48
-
49
-
50
-
51
-
52
-
53
-
54
-
55
-
56
-
57
-
58
-
59
-
60
-
61
-
62
-
63
-
64
-
65
-
66
-
67
-
68
-
69
-
70
-
71
-
72
-
73
-
74
-
75
-
76
-
77
-
78
-
79
-
80
-
81
-
82
-
83
-
84
-
85
-
86
-
 87
87 -
 88
88 -
 89
89 -
 90
90 -
 91
91 -
 92
92 -
 93
93 -
 94
94 -
 95
95 -
 96
96 -
 97
97 -
 98
98 -
 99
99 -
 100
100 -
 101
101 -
 102
102 -
 103
103 -
 104
104 -
 105
105 -
 106
106 -
 107
107 -
108
-
109
-
110
-
111
-
112
-
113
-
114
-
115
-
116
-
117
-
118
-
119
-
120
-
121
-
122
-
123
-
124
-
125
-
126
-
127
-
128
-
129
-
130
-
131
-
132
-
133
-
134
-
135
-
136
-
137
-
138
-
139
-
140
-
141
-
142
-
143
-
144
-
145
-
146
-
147
-
148
-
149
-
150
 |
 |

GE 2012 ANNUAL REPORT 95
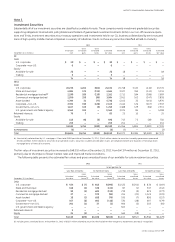
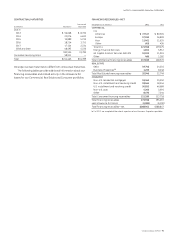
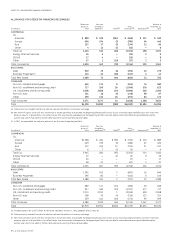
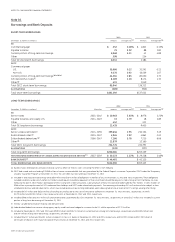
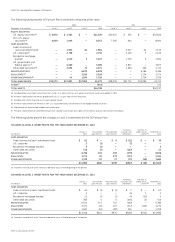
notes to consolidated financial statements
(In millions)
Balance at
January 1,
2010 (a)
Provision
charged to
operations Other (b) Gross
write-offs (c) Recoveries (c)
Balance at
December 31,
2010
COMMERCIAL
CLL
Americas $1,246 $1,059 $ (11) $(1,136) $ 130 $1,288
Europe 575 269 (37) (440) 62 429
Asia 234 153 (6) (181) 22 222
Other 10 (2) (1) (1) — 6
Total CLL 2,065 1,479 (55) (1,758) 214 1,945
Energy Financial Services 28 65 — (72) 1 22
GECAS 104 12 — (96) — 20
Other 34 33 — (9) — 58
Total Commercial 2,231 1,589 (55) (1,935) 215 2,045
REAL ESTATE
Debt 1,355 764 10 (838) 1 1,292
Business Properties 181 146 (8) (126) 3 196
Total Real Estate 1,536 910 2 (964) 4 1,488
CONSUMER
Non-U.S. residential mortgages 825 165 (38) (338) 75 689
Non-U.S. installment and revolving credit 1,106 1,047 (68) (1,733) 585 937
U.S. installment and revolving credit 3,153 3,018 (6) (4,300) 468 2,333
Non-U.S. auto 292 91 (61) (313) 159 168
Other 292 265 5 (394) 91 259
Total Consumer 5,668 4,586 (168) (7,078) 1,378 4,386
Total $9,435 $7,085 $(221) $(9,977) $1,597 $7,919
(a) Reflects the effects of our adoption of ASU 2009-16 & 17 on January 1, 2010.
(b) Other primarily included the effects of currency exchange.
(c) Net write-offs (gross write-offs less recoveries) in certain portfolios may exceed the beginning allowance for losses as our revolving credit portfolios turn over more than
once per year or, in all portfolios, can reflect losses that are incurred subsequent to the beginning of the fiscal year due to information becoming available during the
current year, which may identify further deterioration on existing financing receivables.
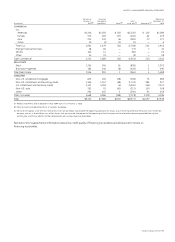
See Note 23 for supplemental information about the credit quality of financing receivables and allowance for losses on
financing receivables.