GE 2012 Annual Report Download - page 116
Download and view the complete annual report
Please find page 116 of the 2012 GE annual report below. You can navigate through the pages in the report by either clicking on the pages listed below, or by using the keyword search tool below to find specific information within the annual report.-
 1
1 -
2
-
3
-
4
-
5
-
6
-
7
-
8
-
9
-
10
-
11
-
12
-
13
-
14
-
15
-
16
-
17
-
18
-
19
-
20
-
21
-
22
-
23
-
24
-
25
-
26
-
27
-
28
-
29
-
30
-
31
-
32
-
33
-
34
-
35
-
36
-
37
-
38
-
39
-
40
-
41
-
42
-
43
-
44
-
45
-
46
-
47
-
48
-
49
-
50
-
51
-
52
-
53
-
54
-
55
-
56
-
57
-
58
-
59
-
60
-
61
-
62
-
63
-
64
-
65
-
66
-
67
-
68
-
69
-
70
-
71
-
72
-
73
-
74
-
75
-
76
-
77
-
78
-
79
-
80
-
81
-
82
-
83
-
84
-
85
-
86
-
87
-
88
-
89
-
90
-
91
-
92
-
93
-
94
-
95
-
96
-
97
-
98
-
99
-
100
-
101
-
102
-
103
-
104
-
105
-
 106
106 -
 107
107 -
 108
108 -
 109
109 -
 110
110 -
 111
111 -
 112
112 -
 113
113 -
 114
114 -
 115
115 -
 116
116 -
 117
117 -
 118
118 -
 119
119 -
 120
120 -
 121
121 -
 122
122 -
 123
123 -
 124
124 -
 125
125 -
 126
126 -
127
-
128
-
129
-
130
-
131
-
132
-
133
-
134
-
135
-
136
-
137
-
138
-
139
-
140
-
141
-
142
-
143
-
144
-
145
-
146
-
147
-
148
-
149
-
150
 |
 |

114 GE 2012 ANNUAL REPORT
notes to consolidated financial statements
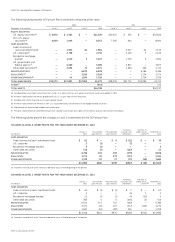
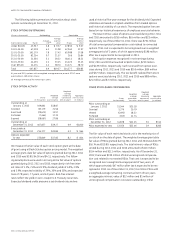
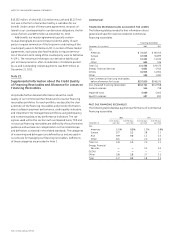
The following table summarizes information about stock
options outstanding at December 31, 2012.
STOCK OPTIONS OUTSTANDING
(Shares in thousands) Outstanding Exercisable
Exercise price range Shares
Average
life (a)
Average
exercise
price Shares
Average
exercise
price
Under $10.00 45,957 5.8 $ 9.57 27,855 $ 9.57
10.01–15.00 67,018 6.1 11.98 42,963 11.97
15.01–20.00 191,179 7.8 17.43 65,988 17.08
20.01–25.00 83,204 9.7 21.57 266 20.84
25.01–30.00 21,550 5.1 28.22 18,411 28.21
30.01–35.00 44,455 2.2 33.25 44,420 33.25
Over $35.00 14,474 4.2 38.70 14,474 38.70
Total 467,837 6.9 $19.27 214,377 $20.85
At year-end 2011, options with a weighted average exercise price of $22.47 were
exercisable on 189 million shares.
(a) Average contractual life remaining in years.
STOCK OPTION ACTIVITY
Shares
(In thousands)
Weighted
average
exercise price
Weighted
average
remaining
contractual
term (In years)
Aggregate
intrinsic value
(In millions)
Outstanding at
January 1, 2012 449,861 $18.87
Granted 83,179 21.56
Exercised (29,672) 11.97
Forfeited (7,464) 17.31
Expired (28,067) 27.86
Outstanding at
December 31, 2012 467,837 $19.27 6.9 $1,810
Exercisable at
December 31, 2012 214,377 $20.85 5.3 $ 964
Options expected
to vest 235,849 $17.82 8.2 $ 814
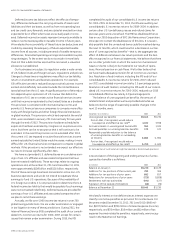
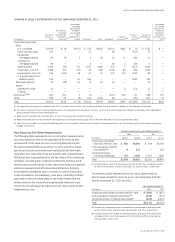
We measure the fair value of each stock option grant at the date
of grant using a Black-Scholes option pricing model. The weighted
average grant-date fair value of options granted during 2012, 2011
and 2010 was $3.80, $4.00 and $4.11, respectively. The follow-
ing assumptions were used in arriving at the fair value of options
granted during 2012, 2011 and 2010, respectively: risk-free inter-
est rates of 1.3%, 2.6% and 2.9%; dividend yields of 4.0%, 3.9%
and 3.9%; expected volatility of 29%, 30% and 35%; and expected
lives of 7.8 years, 7.7 years, and 6.9 years. Risk-free interest
rates reflect the yield on zero-coupon U.S. Treasury securities.
Expected dividend yields presume a set dividend rate and we
used a historical five-year average for the dividend yield. Expected
volatilities are based on implied volatilities from traded options
and historical volatility of our stock. The expected option lives are
based on our historical experience of employee exercise behavior.
The total intrinsic value of options exercised during 2012, 2011
and 2010 amounted to $265 million, $65 million and $23 million,
respectively. As of December 31, 2012, there was $734 million
of total unrecognized compensation cost related to nonvested
options. That cost is expected to be recognized over a weighted
average period of 2 years, of which approximately $198 million
after tax is expected to be recognized in 2013.
Stock option expense recognized in net earnings during
2012, 2011 and 2010 amounted to $220 million, $230 million
and $178 million, respectively. Cash received from option exer-
cises during 2012, 2011 and 2010 was $355 million, $89 million
and $37 million, respectively. The tax benefit realized from stock
options exercised during 2012, 2011 and 2010 was $88 million,
$21 million and $7 million, respectively.
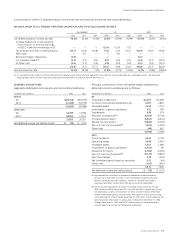
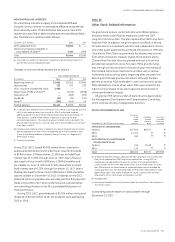
OTHER STOCK-BASED COMPENSATION
Shares
(In thousands)
Weighted
average
grant date
fair value
Weighted
average
remaining
contractual
term (In years)
Aggregate
intrinsic value
(In millions)
RSUs outstanding at
January 1, 2012 15,544 $25.18
Granted 5,379 20.79
Vested (5,692) 28.32
Forfeited (353) 22.74
RSUs outstanding at
December 31, 2012 14,878 $22.45 3.0 $312
RSUs expected to vest 13,556 $22.46 2.9 $285
The fair value of each restricted stock unit is the market price of
our stock on the date of grant. The weighted average grant date
fair value of RSUs granted during 2012, 2011 and 2010 was $20.79,
$16.74 and $15.89, respectively. The total intrinsic value of RSUs
vested during 2012, 2011 and 2010 amounted to $116 million,
$154 million and $111 million, respectively. As of December 31,
2012, there was $190 million of total unrecognized compensa-
tion cost related to nonvested RSUs. That cost is expected to be
recognized over a weighted average period of two years, of
which approximately $47 million after tax is expected to be rec-
ognized in 2013. As of December 31, 2012, 0.6 million PSUs with
a weighted average remaining contractual term of two years,
an aggregate intrinsic value of $12 million and $1 million of
unrecognized compensation cost were outstanding. Other