GE 2012 Annual Report Download - page 130
Download and view the complete annual report
Please find page 130 of the 2012 GE annual report below. You can navigate through the pages in the report by either clicking on the pages listed below, or by using the keyword search tool below to find specific information within the annual report.-
 1
1 -
2
-
3
-
4
-
5
-
6
-
7
-
8
-
9
-
10
-
11
-
12
-
13
-
14
-
15
-
16
-
17
-
18
-
19
-
20
-
21
-
22
-
23
-
24
-
25
-
26
-
27
-
28
-
29
-
30
-
31
-
32
-
33
-
34
-
35
-
36
-
37
-
38
-
39
-
40
-
41
-
42
-
43
-
44
-
45
-
46
-
47
-
48
-
49
-
50
-
51
-
52
-
53
-
54
-
55
-
56
-
57
-
58
-
59
-
60
-
61
-
62
-
63
-
64
-
65
-
66
-
67
-
68
-
69
-
70
-
71
-
72
-
73
-
74
-
75
-
76
-
77
-
78
-
79
-
80
-
81
-
82
-
83
-
84
-
85
-
86
-
87
-
88
-
89
-
90
-
91
-
92
-
93
-
94
-
95
-
96
-
97
-
98
-
99
-
100
-
101
-
102
-
103
-
104
-
105
-
106
-
107
-
108
-
109
-
110
-
111
-
112
-
113
-
114
-
115
-
116
-
117
-
118
-
119
-
 120
120 -
 121
121 -
 122
122 -
 123
123 -
 124
124 -
 125
125 -
 126
126 -
 127
127 -
 128
128 -
 129
129 -
 130
130 -
 131
131 -
 132
132 -
 133
133 -
 134
134 -
 135
135 -
 136
136 -
 137
137 -
 138
138 -
 139
139 -
 140
140 -
141
-
142
-
143
-
144
-
145
-
146
-
147
-
148
-
149
-
150
 |
 |

128 GE 2012 ANNUAL REPORT
notes to consolidated financial statements
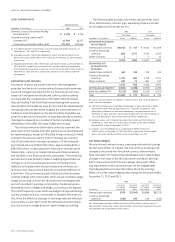
We recognized $329 million and $399 million of interest income,
including $237 million and $339 million on a cash basis, for the
years ended December 31, 2012 and 2011, respectively, principally
in our Real Estate—Debt portfolio. The total average investment in
impaired loans for the years ended December 31, 2012 and 2011
was $7,525 million and $9,678 million, respectively.
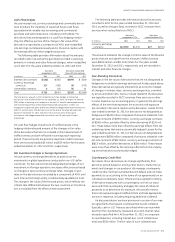
Real Estate TDRs decreased from $7,006 million at
December 31, 2011 to $5,146 million at December 31, 2012,
primarily driven by resolution of TDRs through paydowns,
restructurings, foreclosures and write-offs, partially offset by
extensions of loans scheduled to mature during 2012, some of
which were classified as TDRs upon modification. We deem loan
modifications to be TDRs when we have granted a concession to
a borrower experiencing financial difficulty and we do not receive
adequate compensation in the form of an effective interest rate
that is at current market rates of interest given the risk charac-
teristics of the loan or other consideration that compensates us
for the value of the concession. The limited liquidity and higher
return requirements in the real estate market for loans with
higher loan-to-value (LTV) ratios has typically resulted in the con-
clusion that the modified terms are not at current market rates
of interest, even if the modified loans are expected to be fully
recoverable. For the year ended December 31, 2012, we modi-
fied $4,351 million of loans classified as TDRs, substantially all
in our Debt portfolio. Changes to these loans primarily included
maturity extensions, principal payment acceleration, changes to
collateral or covenant terms and cash sweeps, which are in addi-
tion to, or sometimes in lieu of, fees and rate increases. Of our
$4,351 million of modifications classified as TDRs during 2012,
$210 million have subsequently experienced a payment default
in 2012. Of our $3,965 million of modifications classified as TDRs
during 2011, $140 million have subsequently experienced a pay-
ment default in 2011.
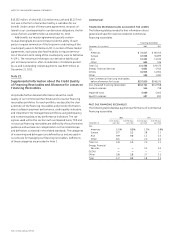
CREDIT QUALITY INDICATORS
Due to the primarily non-recourse nature of our Debt portfolio,
loan-to-value ratios provide the best indicators of the credit qual-
ity of the portfolio. By contrast, the credit quality of the Business
Properties portfolio is primarily influenced by the strength of the
borrower’s general credit quality, which is reflected in our internal
risk rating process, consistent with the process we use for our
Commercial portfolio.
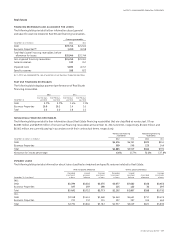
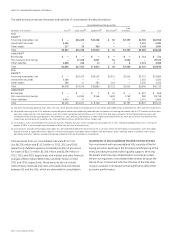
Loan-to-value ratio
December 31 (In millions)
Less than
80%
80% to
95%
Greater than
95%
2012
Debt $13,570 $2,572 $3,604
2011
Debt $14,454 $4,593 $5,454
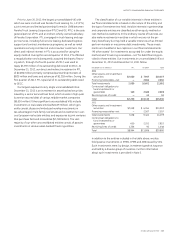
At December 31, 2012, Business Properties receivables of
$956 million, $25 million and $219 million were rated A, B and C,
respectively. At December 31, 2011, Business Properties receiv-
ables of $7,628 million, $110 million and $510 million were rated A,
B and C, respectively.
Within Real Estate—Debt, these financing receivables are
primarily concentrated in our North American and European
Lending platforms and are secured by various property types. A
substantial majority of the Real Estate—Debt financing receiv-
ables with loan-to-value ratios greater than 95% are paying in
accordance with contractual terms. Substantially all of these
loans and the majority of the Real Estate—Business Properties
financing receivables included in Category C are impaired loans
which are subject to the specific reserve evaluation process
described in Note 1. The ultimate recoverability of impaired loans
is driven by collection strategies that do not necessarily depend
on the sale of the underlying collateral and include full or partial
repayments through third-party refinancing and restructurings.
Consumer
At December 31, 2012, our U.S. consumer financing receivables
included private label credit card and sales financing for approxi-
mately 57 million customers across the U.S. with no metropolitan
area accounting for more than 6% of the portfolio. Of the total
U.S. consumer financing receivables, approximately 66% relate
to credit card loans, which are often subject to profit and loss-
sharing arrangements with the retailer (which are recorded in
revenues), and the remaining 34% are sales finance receivables,
which provide financing to customers in areas such as electron-
ics, recreation, medical and home improvement.
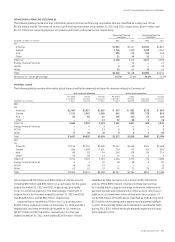
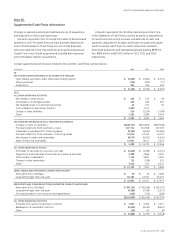
FINANCING RECEIVABLES AND ALLOWANCE FOR LOSSES
The following table provides further information about general
and specific reserves related to Consumer financing receivables.
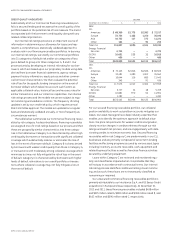
Financing receivables
December 31 (In millions) 2012 2011
Non-U.S. residential mortgages $ 33,451 $ 35,550
Non-U.S. installment and revolving credit 18,546 18,544
U.S. installment and revolving credit 50,853 46,689
Non-U.S. auto 4,260 5,691
Other 8,070 7,244
Total Consumer financing receivables,
before allowance for losses $115,180 $113,718
Non-impaired financing receivables $111,960 $110,825
General reserves 2,950 2,891
Impaired loans 3,220 2,893
Specific reserves 674 680