GE 2012 Annual Report Download - page 47
Download and view the complete annual report
Please find page 47 of the 2012 GE annual report below. You can navigate through the pages in the report by either clicking on the pages listed below, or by using the keyword search tool below to find specific information within the annual report.-
 1
1 -
2
-
3
-
4
-
5
-
6
-
7
-
8
-
9
-
10
-
11
-
12
-
13
-
14
-
15
-
16
-
17
-
18
-
19
-
20
-
21
-
22
-
23
-
24
-
25
-
26
-
27
-
28
-
29
-
30
-
31
-
32
-
33
-
34
-
35
-
36
-
 37
37 -
 38
38 -
 39
39 -
 40
40 -
 41
41 -
 42
42 -
 43
43 -
 44
44 -
 45
45 -
 46
46 -
 47
47 -
 48
48 -
 49
49 -
 50
50 -
 51
51 -
 52
52 -
 53
53 -
 54
54 -
 55
55 -
 56
56 -
 57
57 -
58
-
59
-
60
-
61
-
62
-
63
-
64
-
65
-
66
-
67
-
68
-
69
-
70
-
71
-
72
-
73
-
74
-
75
-
76
-
77
-
78
-
79
-
80
-
81
-
82
-
83
-
84
-
85
-
86
-
87
-
88
-
89
-
90
-
91
-
92
-
93
-
94
-
95
-
96
-
97
-
98
-
99
-
100
-
101
-
102
-
103
-
104
-
105
-
106
-
107
-
108
-
109
-
110
-
111
-
112
-
113
-
114
-
115
-
116
-
117
-
118
-
119
-
120
-
121
-
122
-
123
-
124
-
125
-
126
-
127
-
128
-
129
-
130
-
131
-
132
-
133
-
134
-
135
-
136
-
137
-
138
-
139
-
140
-
141
-
142
-
143
-
144
-
145
-
146
-
147
-
148
-
149
-
150
 |
 |
management’s discussion and analsis
GE 2012 ANNUAL REPORT 45
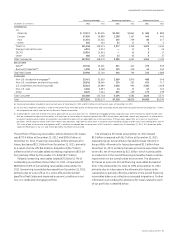
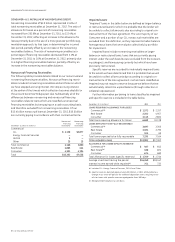
GE Capital revenues decreased 6% and net earnings increased
12% in 2012 as compared with 2011. Revenues for 2012 included
$0.1 billion from acquisitions and were reduced by $0.6 billion as
a result of dispositions. Revenues also decreased as a result of
organic revenues declines, primarily due to lower ENI, the stron-
ger U.S. dollar, and the absence of the 2011 gain on sale of a
substantial portion of our Garanti Bank equity investment (the
Garanti Bank transaction). Net earnings increased by $0.8 billion
in 2012, primarily due to lower impairments and core increases,
including higher tax benefits, partially offset by the absence of
the 2011 gain on the Garanti Bank transaction and operations.
GE Capital net earnings in 2012 also included restructuring,
rationalization and other charges of $0.1 billion and net losses
of $0.2 billion related to our Treasury operations. GE Capital
net earnings excluded $0.1 billion of preferred stock dividends
declared in 2012.
GE Capital revenues decreased 2% and net earnings
increased favorably in 2011 as compared with 2010. Revenues
for 2011 and 2010 included $0.3 billion and $0.2 billion, respec-
tively, from acquisitions and were reduced by $1.1 billion and
$2.3 billion, respectively, as a result of dispositions. Revenues also
increased as a result of the gain on the Garanti Bank transaction,
the weaker U.S. dollar and higher gains and investment income,
partially offset by reduced revenues from lower ENI. Net earnings
increased by $3.5 billion in 2011, primarily due to lower provi-
sions for losses on financing receivables, the gain on the Garanti
Bank transaction and lower impairments. GE Capital net earn-
ings in 2011 also included restructuring, rationalization and other
charges of $0.1 billion and net losses of $0.2 billion related to our
Treasury operations.
Additional information about certain GE Capital busi -
nesses follows.
CLL 2012 revenues decreased 7% and net earnings decreased
11% compared with 2011. Revenues were reduced by $0.4 billion
as a result of dispositions. Revenues also decreased as a result
of organic revenue declines ($0.6 billion), primarily due to lower
ENI ($0.6 billion), and the stronger U.S. dollar ($0.3 billion). Net
earnings decreased reflecting core decreases ($0.2 billion) and
dispositions ($0.1 billion).
CLL 2011 revenues decreased 1% and net earnings increased
75% compared with 2010. Revenues decreased as a result of
organic revenue declines ($1.1 billion), primarily due to lower
ENI, partially offset by the weaker U.S. dollar ($0.5 billion) and
higher gains and investment income ($0.4 billion). Net earnings
increased in 2011, reflecting lower provisions for losses on financ-
ing receivables ($0.6 billion), higher gains and investment income
($0.3 billion), core increases ($0.2 billion) and lower impairments
($0.1 billion).
Consumer 2012 revenues decreased 7% and net earnings
decreased 13% compared with 2011. Revenues included $0.1 bil-
lion from acquisitions and were reduced by $0.1 billion as a result
of dispositions. Revenues in 2012 also decreased as a result of
the absence of the 2011 gain on the Garanti Bank transaction
($0.7 billion), the stronger U.S. dollar ($0.4 billion) and organic rev-
enue declines ($0.2 billion). The decrease in net earnings resulted
primarily from the absence of the 2011 gain on the Garanti Bank
transaction and operations ($0.4 billion), dispositions ($0.1 billion)
and core decreases, which included higher provisions for losses
on financing receivables ($0.2 billion). The higher provisions for
losses on financing receivables reflected the use of a more granu-
lar portfolio segmentation approach, by loss type, in determining
the incurred loss period in our U.S. Installment and Revolving
Credit portfolio.
Consumer 2011 revenues decreased 2% and net earnings
increased 41% compared with 2010. Revenues included $0.3 bil-
lion from acquisitions and were reduced by $0.4 billion as a result
of dispositions. Revenues in 2011 also decreased $0.3 billion as a
result of organic revenue declines ($1.4 billion), primarily due to
lower ENI, and higher impairments ($0.1 billion), partially offset by
the gain on the Garanti Bank transaction ($0.7 billion), the weaker
U.S. dollar ($0.5 billion) and higher gains ($0.1 billion). The increase
in net earnings resulted primarily from lower provisions for losses
on financing receivables ($1.0 billion), the gain on the Garanti
Bank transaction ($0.3 billion), acquisitions ($0.1 billion) and the
weaker U.S. dollar ($0.1 billion), partially offset by lower Garanti
results ($0.2 billion), and core decreases ($0.2 billion).
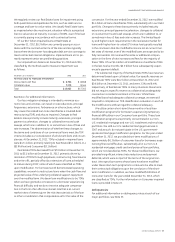
Real Estate 2012 revenues decreased 2% and net earnings
were favorable compared with 2011. Revenues decreased as a
result of organic revenue declines ($0.2 billion), primarily due to
lower ENI, and the stronger U.S. dollar ($0.1 billion), partially off-
set by increases in net gains on property sales ($0.2 billion). Real
Estate net earnings increased as a result of lower impairments
($0.7 billion), core increases ($0.7 billion) including higher tax
benefits of $0.5 billion, lower provisions for losses on financing
receivables ($0.2 billion) and increases in net gains on property
sales ($0.1 billion). Depreciation expense on real estate equity
investments totaled $0.8 billion and $0.9 billion in 2012 and
2011, respectively.
Real Estate 2011 revenues decreased 1% and net earnings
increased 47% compared with 2010. Revenues decreased as
organic revenue declines ($0.4 billion), primarily due to lower
ENI, were partially offset by increases in net gains on property
sales ($0.2 billion) and the weaker U.S. dollar ($0.1 billion). Real
Estate net earnings increased compared with 2010, as lower
impairments ($0.7 billion), a decrease in provisions for losses
on financing receivables ($0.4 billion) and increases in net gains
on property sales ($0.2 billion) were partially offset by core
declines ($0.4 billion). Depreciation expense on real estate equity
investments totaled $0.9 billion and $1.0 billion in 2011 and
2010, respectively.