GE 2012 Annual Report Download - page 104
Download and view the complete annual report
Please find page 104 of the 2012 GE annual report below. You can navigate through the pages in the report by either clicking on the pages listed below, or by using the keyword search tool below to find specific information within the annual report.-
 1
1 -
2
-
3
-
4
-
5
-
6
-
7
-
8
-
9
-
10
-
11
-
12
-
13
-
14
-
15
-
16
-
17
-
18
-
19
-
20
-
21
-
22
-
23
-
24
-
25
-
26
-
27
-
28
-
29
-
30
-
31
-
32
-
33
-
34
-
35
-
36
-
37
-
38
-
39
-
40
-
41
-
42
-
43
-
44
-
45
-
46
-
47
-
48
-
49
-
50
-
51
-
52
-
53
-
54
-
55
-
56
-
57
-
58
-
59
-
60
-
61
-
62
-
63
-
64
-
65
-
66
-
67
-
68
-
69
-
70
-
71
-
72
-
73
-
74
-
75
-
76
-
77
-
78
-
79
-
80
-
81
-
82
-
83
-
84
-
85
-
86
-
87
-
88
-
89
-
90
-
91
-
92
-
93
-
 94
94 -
 95
95 -
 96
96 -
 97
97 -
 98
98 -
 99
99 -
 100
100 -
 101
101 -
 102
102 -
 103
103 -
 104
104 -
 105
105 -
 106
106 -
 107
107 -
 108
108 -
 109
109 -
 110
110 -
 111
111 -
 112
112 -
 113
113 -
 114
114 -
115
-
116
-
117
-
118
-
119
-
120
-
121
-
122
-
123
-
124
-
125
-
126
-
127
-
128
-
129
-
130
-
131
-
132
-
133
-
134
-
135
-
136
-
137
-
138
-
139
-
140
-
141
-
142
-
143
-
144
-
145
-
146
-
147
-
148
-
149
-
150
 |
 |

102 GE 2012 ANNUAL REPORT
notes to consolidated financial statements
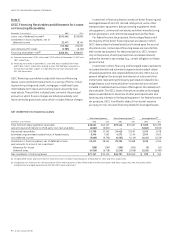
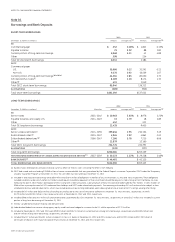
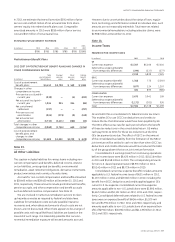
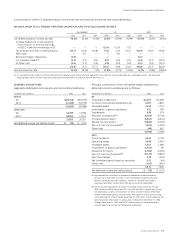
COST OF PENSION PLANS
Total Principal pension plans Other pension plans
(In millions) 2012 2011 2010 2012 2011 2010 2012 2011 2010
Service cost for benefits earned $ 1,779 $ 1,498 $ 1,426 $ 1,387 $ 1,195 $ 1,149 $ 392 $ 303 $ 277
Prior service cost amortization 287 207 252 279 194 238 813 14
Expected return on plan assets (4,394) (4,543) (4,857) (3,768) (3,940) (4,344) (626) (603) (513)
Interest cost on benefit obligations 2,993 3,176 3,179 2,479 2,662 2,693 514 514 486
Net actuarial loss amortization 3,701 2,486 1,546 3,421 2,335 1,336 280 151 210
Pension plans cost $ 4,366 $ 2,824 $ 1,546 $ 3,798 $ 2,446 $ 1,072 $ 568 $ 378 $ 474
ACTUARIAL ASSUMPTIONS are described below. The actuarial assumptions at December 31 are used to measure the year-end benefit
obligations and the pension costs for the subsequent year.
Principal pension plans Other pension plans (weighted average)
December 31 2012 2011 2010 2009 2012 2011 2010 2009
Discount rate 3.96% 4.21% 5.28% 5.78% 3.92% 4.42% 5.11% 5.31%
Compensation increases 3.90 3.75 4.25 4.20 3.30 4.31 4.44 4.56
Expected return on assets 8.00 8.00 8.00 8.50 6.82 7.09 7.25 7.29
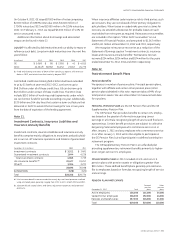
To determine the expected long-term rate of return on pension
plan assets, we consider current and target asset allocations,
as well as historical and expected returns on various categories
of plan assets. In developing future return expectations for our
principal pension plans’ assets, we formulate views on the future
economic environment, both in the U.S. and abroad. We evalu-
ate general market trends and historical relationships among a
number of key variables that impact asset class returns such as
expected earnings growth, inflation, valuations, yields and spreads,
using both internal and external sources. We also take into account
expected volatility by asset class and diversification across classes
to determine expected overall portfolio results given current and
target allocations. Based on our analysis of future expectations
of asset performance, past return results, and our current and
target asset allocations, we have assumed an 8.0% long-term
expected return on those assets for cost recognition in 2013. For
the principal pension plans, we apply our expected rate of return to
a market-related value of assets, which stabilizes variability in the
amounts to which we apply that expected return.
We amortize experience gains and losses, as well as the effects
of changes in actuarial assumptions and plan provisions, over a
period no longer than the average future service of employees.
FUNDING POLICY for the GE Pension Plan is to contribute amounts
sufficient to meet minimum funding requirements as set forth in
employee benefit and tax laws plus such additional amounts as
we may determine to be appropriate. We contributed $433 mil-
lion to the GE Pension Plan in 2012. The ERISA minimum funding
requirements do not require a contribution in 2013. In addi-
tion, we expect to pay approximately $230 million for benefit
payments under our GE Supplementary Pension Plan and admin-
istrative expenses of our principal pension plans and expect to
contribute approximately $735 million to other pension plans
in 2013. In 2012, comparative amounts were $209 million and
$737 million, respectively.
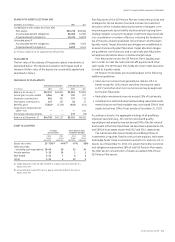
BENEFIT OBLIGATIONS are described in the following tables.
Accumulated and projected benefit obligations (ABO and PBO)
represent the obligations of a pension plan for past service
as of the measurement date. ABO is the present value of ben-
efits earned to date with benefits computed based on current
compensation levels. PBO is ABO increased to reflect expected
future compensation.
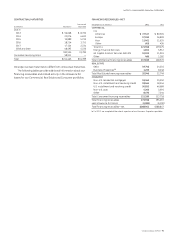
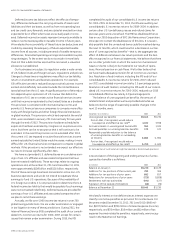
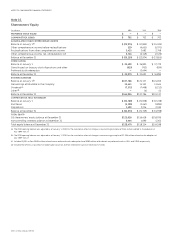
PROJECTED BENEFIT OBLIGATION
Principal pension plans Other pension plans
(In millions) 2012 2011 2012 2011
Balance at January 1 $60,510 $51,999 $11,637 $ 9,907
Service cost for benefits
earned 1,387 1,195 392 303
Interest cost on benefit
obligations 2,479 2,662 514 514
Participant contributions 157 167 16 37
Plan amendments —804 (6) (58)
Actuarial loss (a) 2,021 6,803 890 1,344
Benefits paid (3,052) (3,120) (425) (424)
Acquisitions (dispositions)/
other—net ——230 122
Exchange rate adjustments ——336 (108)
Balance at December 31 (b) $63,502 $60,510 $13,584 $11,637
(a) Principally associated with discount rate changes.
(b) The PBO for the GE Supplementary Pension Plan, which is an unfunded plan, was
$5,494 million and $5,203 million at year-end 2012 and 2011, respectively.
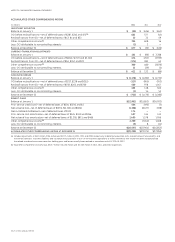
ACCUMULATED BENEFIT OBLIGATION
December 31 (In millions) 2012 2011
GE Pension Plan $55,664 $53,040
GE Supplementary Pension Plan 4,114 3,643
Other pension plans 12,687 10,722