GE 2012 Annual Report Download - page 126
Download and view the complete annual report
Please find page 126 of the 2012 GE annual report below. You can navigate through the pages in the report by either clicking on the pages listed below, or by using the keyword search tool below to find specific information within the annual report.-
 1
1 -
2
-
3
-
4
-
5
-
6
-
7
-
8
-
9
-
10
-
11
-
12
-
13
-
14
-
15
-
16
-
17
-
18
-
19
-
20
-
21
-
22
-
23
-
24
-
25
-
26
-
27
-
28
-
29
-
30
-
31
-
32
-
33
-
34
-
35
-
36
-
37
-
38
-
39
-
40
-
41
-
42
-
43
-
44
-
45
-
46
-
47
-
48
-
49
-
50
-
51
-
52
-
53
-
54
-
55
-
56
-
57
-
58
-
59
-
60
-
61
-
62
-
63
-
64
-
65
-
66
-
67
-
68
-
69
-
70
-
71
-
72
-
73
-
74
-
75
-
76
-
77
-
78
-
79
-
80
-
81
-
82
-
83
-
84
-
85
-
86
-
87
-
88
-
89
-
90
-
91
-
92
-
93
-
94
-
95
-
96
-
97
-
98
-
99
-
100
-
101
-
102
-
103
-
104
-
105
-
106
-
107
-
108
-
109
-
110
-
111
-
112
-
113
-
114
-
115
-
 116
116 -
 117
117 -
 118
118 -
 119
119 -
 120
120 -
 121
121 -
 122
122 -
 123
123 -
 124
124 -
 125
125 -
 126
126 -
 127
127 -
 128
128 -
 129
129 -
 130
130 -
 131
131 -
 132
132 -
 133
133 -
 134
134 -
 135
135 -
 136
136 -
137
-
138
-
139
-
140
-
141
-
142
-
143
-
144
-
145
-
146
-
147
-
148
-
149
-
150
 |
 |

124 GE 2012 ANNUAL REPORT
notes to consolidated financial statements
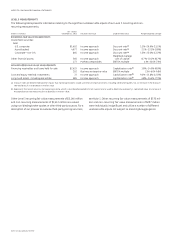
$10,352 million, of which $5,125 million was cash and $5,227 mil-
lion was in the form of securities held by a custodian for our
benefit. Under certain of these same agreements, we post col-
lateral to our counterparties for our derivative obligations, the fair
value of which was $391 million at December 31, 2012.
Additionally, our master agreements typically contain
mutual downgrade provisions that provide the ability of each
party to require termination if the long-term credit rating of the
counterparty were to fall below A-/A3. In certain of these master
agreements, each party also has the ability to require termina-
tion if the short-term rating of the counterparty were to fall below
A-1/P-1. The net amount relating to our derivative liability sub-
ject to these provisions, after consideration of collateral posted
by us, and outstanding interest payments, was $337 million at
December 31, 2012.
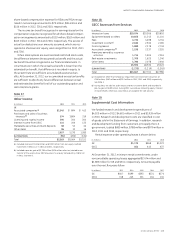
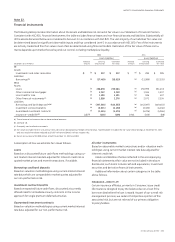
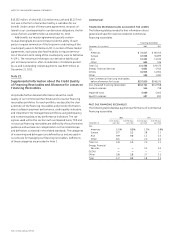
Note 23.
Supplemental Information about the Credit Quality
of Financing Receivables and Allowance for Losses on
Financing Receivables
We provide further detailed information about the credit
quality of our Commercial, Real Estate and Consumer financing
receivables portfolios. For each portfolio, we describe the char-
acteristics of the financing receivables and provide information
about collateral, payment performance, credit quality indicators,
and impairment. We manage these portfolios using delinquency
and nonearning data as key performance indicators. The cat-
egories used within this section such as impaired loans, TDR and
nonaccrual financing receivables are defined by the authoritative
guidance and we base our categorization on the related scope
and definitions contained in the related standards. The categories
of nonearning and delinquent are defined by us and are used in
our process for managing our financing receivables. Definitions
of these categories are provided in Note 1.
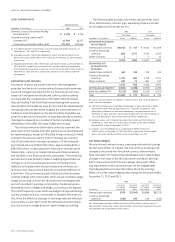
Commercial
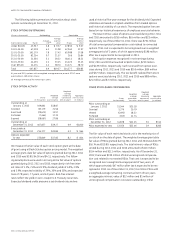
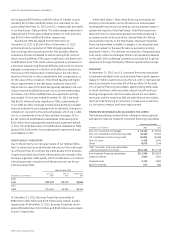
FINANCING RECEIVABLES AND ALLOWANCE FOR LOSSES
The following table provides further information about
general and specific reserves related to Commercial
financing receivables.
Financing receivables
December 31 (In millions) 2012 2011
CLL
Americas $ 72,517 $ 80,505
Europe 37,035 36,899
Asia 11,401 11,635
Other 605 436
Total CLL 121,558 129,475
Energy Financial Services 4,851 5,912
GECAS 10,915 11,901
Other 486 1,282
Total Commercial financing receivables,
before allowance for losses $137,810 $148,570
Non-impaired financing receivables $132,741 $142,908
General reserves 554 718
Impaired loans 5,069 5,662
Specific reserves 487 812
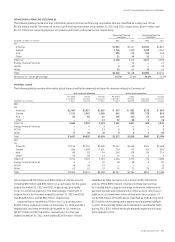
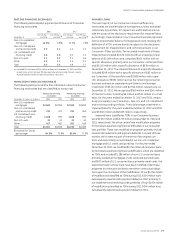
PAST DUE FINANCING RECEIVABLES
The following table displays payment performance of Commercial
financing receivables.
2012 2011
December 31
Over 30 days
past due
Over 90 days
past due
Over 30 days
past due
Over 90 days
past due
CLL
Americas 1.1% 0.5% 1.3% 0.8%
Europe 3.7 2.1 3.8 2.1
Asia 0.9 0.6 1.3 1.0
Other 0.1 — 2.0 0.1
Total CLL 1.9 1.0 2.0 1.2
Energy Financial
Services ——0.3 0.3
GECAS ————
Other 2.8 2.8 3.7 3.5
Total 1.7 0.9 1.8 1.1