GE 2012 Annual Report Download - page 106
Download and view the complete annual report
Please find page 106 of the 2012 GE annual report below. You can navigate through the pages in the report by either clicking on the pages listed below, or by using the keyword search tool below to find specific information within the annual report.-
 1
1 -
2
-
3
-
4
-
5
-
6
-
7
-
8
-
9
-
10
-
11
-
12
-
13
-
14
-
15
-
16
-
17
-
18
-
19
-
20
-
21
-
22
-
23
-
24
-
25
-
26
-
27
-
28
-
29
-
30
-
31
-
32
-
33
-
34
-
35
-
36
-
37
-
38
-
39
-
40
-
41
-
42
-
43
-
44
-
45
-
46
-
47
-
48
-
49
-
50
-
51
-
52
-
53
-
54
-
55
-
56
-
57
-
58
-
59
-
60
-
61
-
62
-
63
-
64
-
65
-
66
-
67
-
68
-
69
-
70
-
71
-
72
-
73
-
74
-
75
-
76
-
77
-
78
-
79
-
80
-
81
-
82
-
83
-
84
-
85
-
86
-
87
-
88
-
89
-
90
-
91
-
92
-
93
-
94
-
95
-
 96
96 -
 97
97 -
 98
98 -
 99
99 -
 100
100 -
 101
101 -
 102
102 -
 103
103 -
 104
104 -
 105
105 -
 106
106 -
 107
107 -
 108
108 -
 109
109 -
 110
110 -
 111
111 -
 112
112 -
 113
113 -
 114
114 -
 115
115 -
 116
116 -
117
-
118
-
119
-
120
-
121
-
122
-
123
-
124
-
125
-
126
-
127
-
128
-
129
-
130
-
131
-
132
-
133
-
134
-
135
-
136
-
137
-
138
-
139
-
140
-
141
-
142
-
143
-
144
-
145
-
146
-
147
-
148
-
149
-
150
 |
 |

104 GE 2012 ANNUAL REPORT
notes to consolidated financial statements
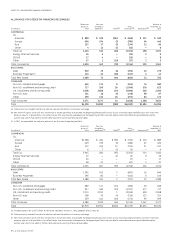
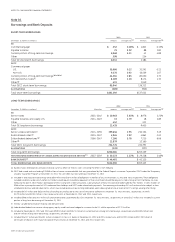
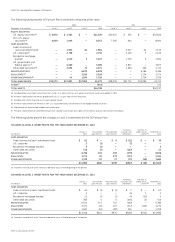
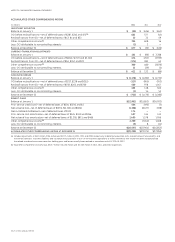
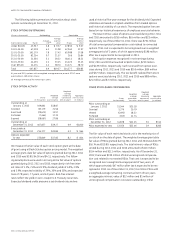
The following table presents GE Pension Plan investments measured at fair value.
2012 2011
December 31 (In millions) Level 1 Level 2 Level 3 Total Level 1 Level 2 Level 3 Total
EQUITY SECURITIES
U.S. equity securities (a) $ 8,876 $ 2,462 $ — $11,338 $10,645 $ 191 $ — $10,836
Non-U.S. equity
securities (a) 6,699 1,644 — 8,343 7,360 644 — 8,004
DEBT SECURITIES
Fixed income and
cash investment funds — 1,931 50 1,981 — 2,057 62 2,119
U.S. corporate (b) — 2,758 — 2,758 — 2,126 3 2,129
Residential mortgage-
backed — 1,420 3 1,423 — 1,276 5 1,281
U.S. government and
federal agency (c) — 5,489 — 5,489 — 3,872 — 3,872
Other debt securities (d) — 2,053 22 2,075 — 1,566 146 1,712
PRIVATE EQUITIES
(a) — — 6,878 6,878 — — 6,786 6,786
REAL ESTATE
(a) — — 3,356 3,356 — — 3,274 3,274
OTHER INVESTMENTS
(e) — 44 1,694 1,738 — — 1,709 1,709
TOTAL INVESTMENTS $15,575 $17,801 $12,003 45,379 $18,005 $11,732 $11,985 41,722
OTHER (f) (641) 415
TOTAL ASSETS $44,738 $42,137
(a) Included direct investments and investment funds. U.S. equity and non-U.S. equity investment funds were added in 2012.
(b) Primarily represented investment grade bonds of U.S. issuers from diverse industries.
(c) Included short-term investments to meet liquidity needs.
(d) Primarily represented investments in non-U.S. corporate bonds and commercial mortgage-backed securities.
(e) Substantially all represented hedge fund investments.
(f) Primarily represented net unsettled transactions related to purchases and sales of investments and accrued income receivables.
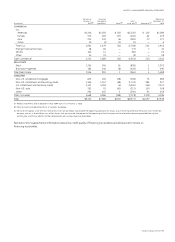
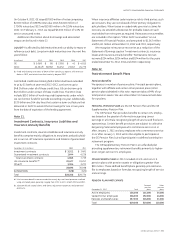
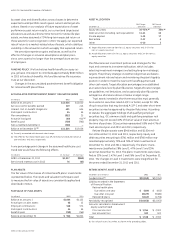
The following tables present the changes in Level 3 investments for the GE Pension Plan.
CHANGES IN LEVEL 3 INVESTMENTS FOR THE YEAR ENDED DECEMBER 31, 2012
(In millions)
January 1,
2012
Net realized
gains (losses)
Net unrealized
gains (losses)
Purchases,
issuances and
settlements
Transfers in
and/or out of
Level 3 (a) December 31,
2012
DEBT SECURITIES
Fixed income and cash investment funds $ 62 $ — $ 9 $ (21) $ — $ 50
U.S. corporate 3(1)—(2)——
Residential mortgage-backed 5 (2) — — — 3
Other debt securities 146 (2) — (122) — 22
PRIVATE EQUITIES 6,786 133 438 (479) — 6,878
REAL ESTATE 3,274 20 279 (217) — 3,356
OTHER INVESTMENTS 1,709 32 72 (71) (48) 1,694
$11,985 $180 $798 $(912) $ (48) $12,003
(a) Transfers in and out of Level 3 are considered to occur at the beginning of the period.
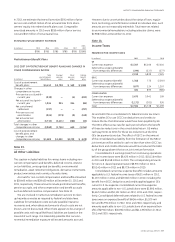
CHANGES IN LEVEL 3 INVESTMENTS FOR THE YEAR ENDED DECEMBER 31, 2011
(In millions)
January 1,
2011
Net realized
gains (losses)
Net unrealized
gains (losses)
Purchases,
issuances and
settlements
Transfers in
and/or out of
Level 3 (a) December 31,
2011
DEBT SECURITIES
Fixed income and cash investment funds $ 65 $ (1) $ (4) $ 2 $ — $ 62
U.S. corporate 5 — — (5) 3 3
Residential mortgage-backed 21 (1) (1) (4) (10) 5
Other debt securities 283 4 6 (145) (2) 146
PRIVATE EQUITIES 6,014 311 701 (240) — 6,786
REAL ESTATE 3,373 (70) 320 (217) (132) 3,274
OTHER INVESTMENTS 1,687 (41) (87) 150 — 1,709
$11,448 $202 $935 $(459) $(141) $11,985
(a) Transfers in and out of Level 3 are considered to occur at the beginning of the period.