GE 2012 Annual Report Download - page 38
Download and view the complete annual report
Please find page 38 of the 2012 GE annual report below. You can navigate through the pages in the report by either clicking on the pages listed below, or by using the keyword search tool below to find specific information within the annual report.-
 1
1 -
2
-
3
-
4
-
5
-
6
-
7
-
8
-
9
-
10
-
11
-
12
-
13
-
14
-
15
-
16
-
17
-
18
-
19
-
20
-
21
-
22
-
23
-
24
-
25
-
26
-
27
-
 28
28 -
 29
29 -
 30
30 -
 31
31 -
 32
32 -
 33
33 -
 34
34 -
 35
35 -
 36
36 -
 37
37 -
 38
38 -
 39
39 -
 40
40 -
 41
41 -
 42
42 -
 43
43 -
 44
44 -
 45
45 -
 46
46 -
 47
47 -
 48
48 -
49
-
50
-
51
-
52
-
53
-
54
-
55
-
56
-
57
-
58
-
59
-
60
-
61
-
62
-
63
-
64
-
65
-
66
-
67
-
68
-
69
-
70
-
71
-
72
-
73
-
74
-
75
-
76
-
77
-
78
-
79
-
80
-
81
-
82
-
83
-
84
-
85
-
86
-
87
-
88
-
89
-
90
-
91
-
92
-
93
-
94
-
95
-
96
-
97
-
98
-
99
-
100
-
101
-
102
-
103
-
104
-
105
-
106
-
107
-
108
-
109
-
110
-
111
-
112
-
113
-
114
-
115
-
116
-
117
-
118
-
119
-
120
-
121
-
122
-
123
-
124
-
125
-
126
-
127
-
128
-
129
-
130
-
131
-
132
-
133
-
134
-
135
-
136
-
137
-
138
-
139
-
140
-
141
-
142
-
143
-
144
-
145
-
146
-
147
-
148
-
149
-
150
 |
 |
management’s discussion and analsis
36 GE 2012 ANNUAL REPORT
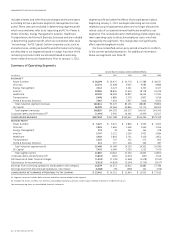
Significant matters relating to our Statement of Earnings are
explained below.
GE SALES OF PRODUCT SERVICES were $43.4 billion in 2012, an
increase of 4% compared with 2011, and operating profit from
product services was $12.5 billion in 2012, an increase of 6%
compared with 2011. Both the sales and operating profit of prod-
uct services increases were at Power & Water, Oil & Gas,
Transportation and Energy Management. GE sales of product
services were $41.9 billion in 2011, an increase of 14% compared
with 2010, and operating profit from product services was
$11.8 billion in 2011, an increase of 15% compared with 2010.
Both the sales and operating profit of product services increases
were at Oil & Gas, Energy Management, Aviation, Transportation
and Healthcare.
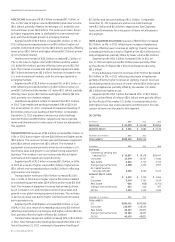
POSTRETIREMENT BENEFIT PLANS costs were $5.5 billion, $4.1 bil-
lion and $3.0 billion in 2012, 2011 and 2010, respectively. Costs
increased in 2012 primarily due to the continued amortization of
2008 investment losses and the effects of lower discount rates
(principal pension plans discount rate decreased from 5.28% at
December 31, 2010 to 4.21% at December 31, 2011). Costs
increased in 2011 primarily due to the continued amortization of
2008 investment losses and the effects of lower discount rates
(principal pension plans discount rate decreased from 5.78% at
December 31, 2009 to 5.28% at December 31, 2010).
Our discount rate for our principal pension plans at
December 31, 2012 was 3.96%, which reflected current histori-
cally low interest rates. Considering the current and target asset
allocations, as well as historical and expected returns on various
categories of assets in which our plans are invested, we have
assumed that long-term returns on our principal pension plan
assets will be 8.0% for cost recognition in 2013, compared to
8.0% in both 2012 and 2011 and 8.5% in 2010. GAAP provides for
recognition of differences between assumed and actual returns
over a period no longer than the average future service of
employees. See the Critical Accounting Estimates section for
additional information.
We expect the costs of our postretirement benefits to
increase in 2013 by approximately $0.4 billion as compared to
2012, primarily because of the effects of additional 2008 invest-
ment loss amortization and lower discount rates. Based on our
current assumptions, we expect that loss amortization related to
our principal pension plans will peak in 2013 and, as a result, our
postretirement benefits costs should decline in 2014.
Pension expense for our principal pension plans on a GAAP
basis was $3.8 billion, $2.4 billion and $1.1 billion in 2012, 2011
and 2010, respectively. Operating pension costs (non-GAAP) for
these plans were $1.7 billion in 2012 and $1.4 billion in both 2011
and 2010. Operating earnings include service cost and prior ser-
vice cost amortization for our principal pension plans as these
costs represent expenses associated with employee service.
Operating earnings exclude non-operating pension costs/
income such as interest cost, expected return on plan assets and
non-cash amortization of actuarial gains and losses. Operating
pension costs increased in 2012 primarily due to the effects of
lower discount rates and additional prior service cost amortiza-
tion resulting from 2011 union negotiations. We expect operating
pension costs for these plans will be about $1.7 billion in 2013.
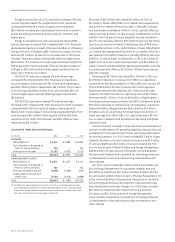
The GE Pension Plan was underfunded by $13.3 billion at the
end of 2012 as compared to $13.2 billion at December 31, 2011.
The GE Supplementary Pension Plan, which is an unfunded plan,
had projected benefit obligations of $5.5 billion and $5.2 billion
at December 31, 2012 and 2011, respectively. Our underfund-
ing at year-end 2012 was relatively consistent with 2011 as the
effects of lower discount rates and liability growth were primar-
ily offset by higher investment returns (11.7% return in 2012).
Our principal pension plans discount rate decreased from 4.21%
at December 31, 2011 to 3.96% at December 31, 2012, which
increased the pension benefit obligation at year-end 2012 by
approximately $2.0 billion. A 100 basis point increase in our pen-
sion discount rate would decrease the pension benefit obligation
at year-end by approximately $7.4 billion. Our GE Pension Plan
assets increased from $42.1 billion at the end of 2011 to $44.7 bil-
lion at December 31, 2012, primarily driven by higher investment
returns that were partially offset by benefit payments made dur-
ing the year. Assets of the GE Pension Plan are held in trust, solely
for the benefit of Plan participants, and are not available for gen-
eral company operations.
On July 6, 2012, the U.S. Government enacted the “Moving
Ahead for Progress in the 21st Century Act,” which contained
provisions that changed the interest rate methodology used
to calculate Employee Retirement Income Security Act (ERISA)
minimum pension funding requirements in the U.S. This change
reduced our near-term annual cash funding requirements for the
GE Pension Plan. We contributed $0.4 billion to the GE Pension
Plan in 2012. We are not required to contribute to the GE Pension
Plan in 2013.
On an ERISA basis, our preliminary estimate is that the GE
Pension Plan was approximately 100% funded at January 1, 2013.
Based on this, our current best estimate of the projected 2014 GE
Pension Plan required contribution is approximately $0.6 billion.
At December 31, 2012, the fair value of assets for our other
pension plans was $3.9 billion less than the respective projected
benefit obligations. The comparable amount at December 31,
2011, was $3.3 billion. This increase was primarily attributable to
lower discount rates. We expect to contribute $0.7 billion to our
other pension plans in 2013, the same as in both 2012 and 2011.
The unfunded liability for our principal retiree health and life
plans was $10.9 billion and $12.1 billion at December 31, 2012 and
2011, respectively. This decrease was primarily attributable to a
plan amendment that affected retiree health and life benefit eligi-
bility for certain salaried plan participants and lower cost trends
which were partially offset by the effects of lower discount rates