GE 2012 Annual Report Download - page 63
Download and view the complete annual report
Please find page 63 of the 2012 GE annual report below. You can navigate through the pages in the report by either clicking on the pages listed below, or by using the keyword search tool below to find specific information within the annual report.-
 1
1 -
2
-
3
-
4
-
5
-
6
-
7
-
8
-
9
-
10
-
11
-
12
-
13
-
14
-
15
-
16
-
17
-
18
-
19
-
20
-
21
-
22
-
23
-
24
-
25
-
26
-
27
-
28
-
29
-
30
-
31
-
32
-
33
-
34
-
35
-
36
-
37
-
38
-
39
-
40
-
41
-
42
-
43
-
44
-
45
-
46
-
47
-
48
-
49
-
50
-
51
-
52
-
 53
53 -
 54
54 -
 55
55 -
 56
56 -
 57
57 -
 58
58 -
 59
59 -
 60
60 -
 61
61 -
 62
62 -
 63
63 -
 64
64 -
 65
65 -
 66
66 -
 67
67 -
 68
68 -
 69
69 -
 70
70 -
 71
71 -
 72
72 -
 73
73 -
74
-
75
-
76
-
77
-
78
-
79
-
80
-
81
-
82
-
83
-
84
-
85
-
86
-
87
-
88
-
89
-
90
-
91
-
92
-
93
-
94
-
95
-
96
-
97
-
98
-
99
-
100
-
101
-
102
-
103
-
104
-
105
-
106
-
107
-
108
-
109
-
110
-
111
-
112
-
113
-
114
-
115
-
116
-
117
-
118
-
119
-
120
-
121
-
122
-
123
-
124
-
125
-
126
-
127
-
128
-
129
-
130
-
131
-
132
-
133
-
134
-
135
-
136
-
137
-
138
-
139
-
140
-
141
-
142
-
143
-
144
-
145
-
146
-
147
-
148
-
149
-
150
 |
 |

management’s discussion and analsis
GE 2012 ANNUAL REPORT 61
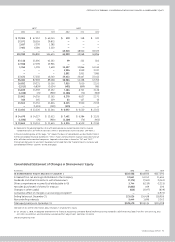
Elements of accumulated other comprehensive income (AOCI)
increased shareowners’ equity by $3.7 billion in 2012, compared
with decreases of $6.1 billion in 2011 and $2.3 billion in 2010,
respectively, inclusive of changes in accounting principles. The
components of these changes are as follows:
Þ Changes in AOCI related to benefit plans increased share-
owners’ equity by $2.3 billion in 2012, primarily reflecting
amortization of actuarial losses and prior service costs out of
AOCI, higher asset values and changes to our principal retiree
benefit plans, partially offset by lower discount rates used
to measure pension and postretirement benefit obligations.
This compared with a decrease of $7.0 billion and an increase
of $1.1 billion in 2011 and 2010, respectively. The decrease in
2011 primarily reflected lower discount rates used to mea-
sure pension and postretirement benefit obligations and
lower asset values, partially offset by amortization of actuarial
losses and prior service costs out of AOCI. The increase in
2010 primarily reflected prior service cost and net actuarial
loss amortization out of AOCI and higher fair value of plan
assets, partially offset by lower discount rates used to mea-
sure pension and postretirement benefit obligations. Further
information about changes in benefit plans is provided in
Note 12.
Þ Changes in AOCI related to investment securities increased
shareowners’ equity by $0.7 billion and $0.6 billion in 2012
and 2011, respectively, reflecting the effects of lower inter-
est rates and improved market conditions on U.S. corporate
securities, partially offset by adjustments to reflect the effect
of the unrealized gains on insurance-related assets and
equity. Investment securities increased shareowners’ equity
by an insignificant amount in 2010. Further information about
investment securities is provided in Note 3.
Þ Changes in AOCI related to the fair value of derivatives des-
ignated as cash flow hedges increased shareowners’ equity
by $0.5 billion in 2012, primarily reflecting releases from
AOCI contemporaneous with the earnings effects of the
related hedged items, principally as an adjustment of inter-
est expense on borrowings. Cash flow hedges increased
shareowners’ equity by $0.1 billion and $0.5 billion in 2011 and
2010, respectively. Further information about the fair value of
derivatives is provided in Note 22.
Þ Changes in AOCI related to currency translation adjustments
increased shareowners’ equity by $0.3 billion in 2012 and
$0.2 billion in 2011 and decreased equity by $3.9 billion in
2010. Changes in currency translation adjustments reflect
the effects of changes in currency exchange rates on our net
investment in non-U.S. subsidiaries that have functional cur-
rencies other than the U.S. dollar. At year-end 2012, the U.S.
dollar weakened against most major currencies, including
the pound sterling and the euro, and strengthened against
the Japanese yen resulting in increases in currency transla-
tion adjustments which were partially offset by releases from
AOCI related to dispositions. At year-end 2011 and 2010, the
dollar strengthened against most major currencies, including
the pound sterling and the euro and weakened against the
Australian dollar and the Japanese yen.
Noncontrolling interests included in shareowners’ equity
increased $3.7 billion in 2012, principally as a result of the issu-
ance of preferred stock by GECC. Noncontrolling interests
decreased by $3.6 billion in 2011 and $2.6 billion in 2010, princi-
pally as a result of dispositions.
Statement of Cash Flows—Overview from 2010 through 2012
Consolidated cash and equivalents were $77.4 billion at
December 31, 2012, a decrease of $7.1 billion from December 31,
2011. Cash and equivalents totaled $84.5 billion at December 31,
2011, an increase of $5.6 billion from December 31, 2010.
We evaluate our cash flow performance by reviewing our
industrial (non-financial services) businesses and financial ser-
vices businesses separately. Cash from operating activities (CFOA)
is the principal source of cash generation for our industrial busi-
nesses. The industrial businesses also have liquidity available via
the public capital markets. Our financial services businesses use
a variety of financial resources to meet our capital needs. Cash
for financial services businesses is primarily provided from the
issuance of term debt and commercial paper in the public and
private markets and deposits, as well as financing receivables col-
lections, sales and securitizations.
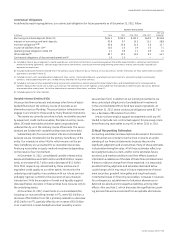
GE Cash Flows
GE cash and equivalents were $15.5 billion at December 31, 2012,
compared with $8.4 billion at December 31, 2011. GE CFOA
totaled $17.8 billion in 2012 compared with $12.1 billion and
$14.7 billion in 2011 and 2010, respectively. With respect to GE
CFOA, we believe that it is useful to supplement our GE Statement
of Cash Flows and to examine in a broader context the business
activities that provide and require cash.
GE CFOA increased $5.8 billion compared with 2011, primar-
ily due to dividends paid by GECC of $6.4 billion. In 2011, GE CFOA
decreased $2.7 billion compared with 2010, primarily due to the
impact of the disposal of NBCU.
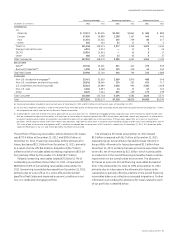
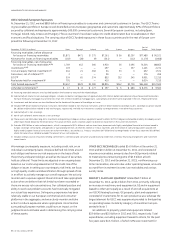
(In billions) 2012 2011 2010
Operating cash collections (a) $105.4 $ 93.6 $ 98.2
Operating cash payments (94.0) (81.5) (83.5)
Cash dividends from GECC 6.4 — —
GE cash from operating activities
(GE CFOA) (a) $ 17.8 $ 12.1 $ 14.7
(a) GE sells customer receivables to GECC in part to fund the growth of our
industrial businesses. These transactions can result in cash generation or cash
use. During any given period, GE receives cash from the sale of receivables to
GECC. It also foregoes collection of cash on receivables sold. The incremental
amount of cash received from sale of receivables in excess of the cash GE would
have otherwise collected had those receivables not been sold, represents the
cash generated or used in the period relating to this activity. The incremental
cash generated in GE CFOA from selling these receivables to GECC increased GE
CFOA by $1.9 billion in 2012, increased GE CFOA by $1.2 billion in 2011 and
decreased GE CFOA by $0.4 billion in 2010. See Note 27 for additional information
about the elimination of intercompany transactions between GE and GECC.