GE 2012 Annual Report Download - page 93
Download and view the complete annual report
Please find page 93 of the 2012 GE annual report below. You can navigate through the pages in the report by either clicking on the pages listed below, or by using the keyword search tool below to find specific information within the annual report.-
 1
1 -
2
-
3
-
4
-
5
-
6
-
7
-
8
-
9
-
10
-
11
-
12
-
13
-
14
-
15
-
16
-
17
-
18
-
19
-
20
-
21
-
22
-
23
-
24
-
25
-
26
-
27
-
28
-
29
-
30
-
31
-
32
-
33
-
34
-
35
-
36
-
37
-
38
-
39
-
40
-
41
-
42
-
43
-
44
-
45
-
46
-
47
-
48
-
49
-
50
-
51
-
52
-
53
-
54
-
55
-
56
-
57
-
58
-
59
-
60
-
61
-
62
-
63
-
64
-
65
-
66
-
67
-
68
-
69
-
70
-
71
-
72
-
73
-
74
-
75
-
76
-
77
-
78
-
79
-
80
-
81
-
82
-
 83
83 -
 84
84 -
 85
85 -
 86
86 -
 87
87 -
 88
88 -
 89
89 -
 90
90 -
 91
91 -
 92
92 -
 93
93 -
 94
94 -
 95
95 -
 96
96 -
 97
97 -
 98
98 -
 99
99 -
 100
100 -
 101
101 -
 102
102 -
 103
103 -
104
-
105
-
106
-
107
-
108
-
109
-
110
-
111
-
112
-
113
-
114
-
115
-
116
-
117
-
118
-
119
-
120
-
121
-
122
-
123
-
124
-
125
-
126
-
127
-
128
-
129
-
130
-
131
-
132
-
133
-
134
-
135
-
136
-
137
-
138
-
139
-
140
-
141
-
142
-
143
-
144
-
145
-
146
-
147
-
148
-
149
-
150
 |
 |

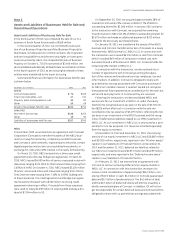
GE 2012 ANNUAL REPORT 91
notes to consolidated financial statements
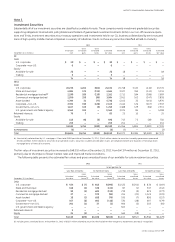
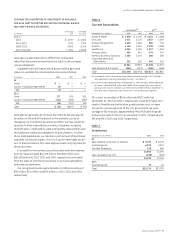
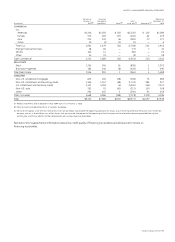
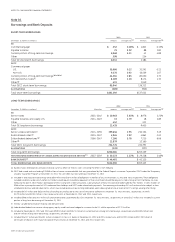
CONTRACTUAL MATURITIES OF INVESTMENT IN AVAILABLE-
FOR-SALE DEBT SECURITIES (EXCLUDING MORTGAGE-BACKED
AND ASSET-BACKED SECURITIES)
(In millions)
Amortized
cost
Estimated
fair value
Due in
2013 $ 1,937 $ 1,960
2014–2017 7,191 7,204
2018–2022 4,803 5,304
2023 and later 17,901 21,998
We expect actual maturities to differ from contractual
maturities because borrowers have the right to call or prepay
certain obligations.
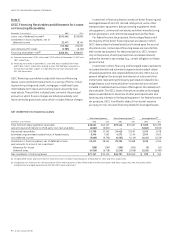
Supplemental information about gross realized gains and
losses on available-for-sale investment securities follows.
(In millions) 2012 2011 2010
GE
Gains $ — $ — $ —
Losses, including impairments (1) ——
Net (1) ——
GECC
Gains 177 205 190
Losses, including impairments (211) (402) (281)
Net (34) (197) (91)
Total $ (35) $(197) $ (91)
Although we generally do not have the intent to sell any specific
securities at the end of the period, in the ordinary course of
managing our investment securities portfolio, we may sell securi-
ties prior to their maturities for a variety of reasons, including
diversification, credit quality, yield and liquidity requirements and
the funding of claims and obligations to policyholders. In some
of our bank subsidiaries, we maintain a certain level of purchases
and sales volume principally of non-U.S. government debt securi-
ties. In these situations, fair value approximates carrying value for
these securities.
Proceeds from investment securities sales and early redemp-
tions by issuers totaled $12,745 million, $15,606 million and
$16,238 million in 2012, 2011 and 2010, respectively, principally
from the sales of short-term securities in our bank subsidiaries
and treasury operations.
We recognized pre-tax gains (losses) on trading securities of
$20 million, $22 million and $(7) million in 2012, 2011 and 2010,
respectively.
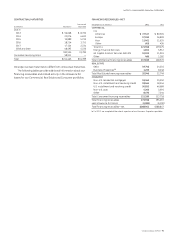
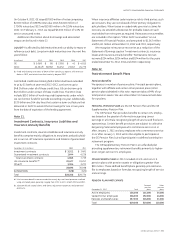
Note 4.
Current Receivables
Consolidated (a) GE (b)
December 31 (In millions) 2012 2011 2012 2011
Power & Water $ 3,809 $ 4,240 $ 2,532 $ 3,498
Oil & Gas 5,421 4,224 2,637 2,269
Energy Management 1,600 1,484 800 791
Aviation 4,756 4,355 2,493 2,658
Healthcare 4,253 4,306 2,012 1,943
Transportation 485 441 324 347
Home & Business Solutions 1,286 1,330 186 184
Corporate items and
eliminations 352 550 344 563
21,962 20,930 11,328 12,253
Less allowance for losses (462) (452) (456) (446)
Total $21,500 $20,478 $10,872 $11,807
(a) Included GE industrial customer receivables factored through a GECC affiliate
and reported as financing receivables by GECC. See Note 27.
(b) GE current receivables balances at December 31, 2012 and 2011, before allowance
for losses, included $7,881 million and $8,994 million, respectively, from sales of
goods and services to customers, and $70 million and $65 million at December 31,
2012 and 2011, respectively, from transactions with associated companies.
GE current receivables of $114 million and $112 million at
December 31, 2012 and 2011, respectively, arose from sales, prin-
cipally of Healthcare and Aviation goods and services, on open
account to various agencies of the U.S. government. As a per-
centage of GE revenues, approximately 4% of GE sales of goods
and services were to the U.S. government in 2012, compared with
4% and 5% in 2011 and 2010, respectively.
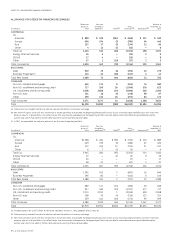
Note 5.
Inventories
December 31 (In millions) 2012 2011
GE
Raw materials and work in process $ 9,295 $ 8,735
Finished goods 6,020 4,971
Unbilled shipments 378 485
15,693 14,191
Less revaluation to LIFO (398) (450)
15,295 13,741
GECC
Finished goods 79 51
Total $15,374 $13,792