GE 2012 Annual Report Download - page 48
Download and view the complete annual report
Please find page 48 of the 2012 GE annual report below. You can navigate through the pages in the report by either clicking on the pages listed below, or by using the keyword search tool below to find specific information within the annual report.-
 1
1 -
2
-
3
-
4
-
5
-
6
-
7
-
8
-
9
-
10
-
11
-
12
-
13
-
14
-
15
-
16
-
17
-
18
-
19
-
20
-
21
-
22
-
23
-
24
-
25
-
26
-
27
-
28
-
29
-
30
-
31
-
32
-
33
-
34
-
35
-
36
-
37
-
 38
38 -
 39
39 -
 40
40 -
 41
41 -
 42
42 -
 43
43 -
 44
44 -
 45
45 -
 46
46 -
 47
47 -
 48
48 -
 49
49 -
 50
50 -
 51
51 -
 52
52 -
 53
53 -
 54
54 -
 55
55 -
 56
56 -
 57
57 -
 58
58 -
59
-
60
-
61
-
62
-
63
-
64
-
65
-
66
-
67
-
68
-
69
-
70
-
71
-
72
-
73
-
74
-
75
-
76
-
77
-
78
-
79
-
80
-
81
-
82
-
83
-
84
-
85
-
86
-
87
-
88
-
89
-
90
-
91
-
92
-
93
-
94
-
95
-
96
-
97
-
98
-
99
-
100
-
101
-
102
-
103
-
104
-
105
-
106
-
107
-
108
-
109
-
110
-
111
-
112
-
113
-
114
-
115
-
116
-
117
-
118
-
119
-
120
-
121
-
122
-
123
-
124
-
125
-
126
-
127
-
128
-
129
-
130
-
131
-
132
-
133
-
134
-
135
-
136
-
137
-
138
-
139
-
140
-
141
-
142
-
143
-
144
-
145
-
146
-
147
-
148
-
149
-
150
 |
 |

management’s discussion and analsis
46 GE 2012 ANNUAL REPORT
Energy Financial Services 2012 revenues increased 23% and
net earnings decreased 2% compared with 2011. Revenues
increased primarily as a result of organic revenue growth
($0.3 billion), including the consolidation of an entity involved in
power generating activities and asset sales by investees, and
higher gains.
Energy Financial Services 2011 revenues decreased 38%
and net earnings increased 20% compared with 2010. Revenues
decreased primarily as a result of the deconsolidation of Regency
Energy Partners L.P. (Regency) ($0.7 billion) and organic revenue
declines ($0.3 billion), primarily from an asset sale in 2010 by an
investee. These decreases were partially offset by higher gains
($0.2 billion). The increase in net earnings resulted primarily from
higher gains ($0.2 billion), partially offset by the deconsolidation
of Regency ($0.1 billion) and core decreases, primarily from an
asset sale in 2010 by an investee.
GECAS 2012 revenues increased 1% and net earnings
increased 6% compared with 2011. Revenues increased as a
result of organic revenue growth ($0.2 billion) and higher gains,
partially offset by higher impairments ($0.2 billion). The increase
in net earnings resulted primarily from core increases ($0.1 bil-
lion) and higher gains, partially offset by higher impairments
($0.1 billion).
GECAS 2011 revenues increased 3% and net earnings
decreased 4% compared with 2010. Revenues for 2011 increased
compared with 2010 as a result of organic revenue growth
($0.1 billion). The decrease in net earnings resulted primarily from
core decreases ($0.1 billion), reflecting the 2010 benefit from
resolution of the 2003-2005 IRS audit, partially offset by lower
impairments ($0.1 billion).
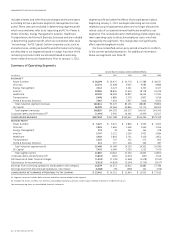
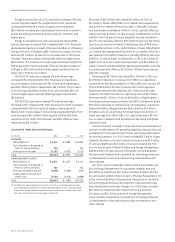
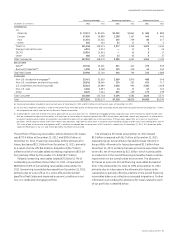
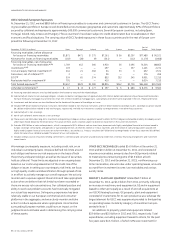
CORPORATE ITEMS AND ELIMINATIONS
(In millions) 2012 2011 2010
REVENUES
NBCU/NBCU LLC $ 1,615 $ 5,686 $16,901
Gains (losses) on disposed or
held for sale businesses 186 — 105
Eliminations and other (3,292) (2,691) (2,511)
Total $(1,491) $ 2,995 $14,495
OPERATING PROFIT (COST)
NBCU/NBCU LLC $ 1,615 $ 4,535 $ 2,261
Gains (losses) on disposed or
held for sale businesses 186 — 105
Principal retirement plans (a) (3,098) (1,898) (493)
Unallocated corporate and
other costs (3,545) (2,924) (2,886)
Total $(4,842) $ (287) $ (1,013)
(a) Included non-operating pension income (cost) for our principal pension plans
(non-GAAP) of $(2.1) billion, $(1.1) billion and $0.3 billion in 2012, 2011 and 2010,
respectively, which includes expected return on plan assets, interest costs and
non-cash amortization of actuarial gains and losses.
Revenues of $(1.5) billion decreased $4.5 billion in 2012 as
$4.1 billion of lower NBCU/NBCU LLC related revenues (primarily
due to the non-repeat of the pre-tax gain on the NBCU transac-
tion and the deconsolidation of NBCU in 2011, partially offset by
higher earnings at NBCU LLC due to a gain on disposition in 2012)
and $0.1 billion of pre-tax losses related to the sale of a plant in
the U.K. were partially offset by $0.3 billion of gains on the forma-
tion of a joint venture at Aviation. Operating costs of $4.8 billion
increased $4.6 billion in 2012 as $2.9 billion of lower NBCU/NBCU
LLC related earnings (primarily due to the non-repeat of the 2011
gain related to the NBCU transaction, partially offset by earnings
at NBCU LLC due to a gain on disposition in 2012), $1.2 billion of
higher costs of our principal retirement plans and $0.4 billion of
higher research and development spending and global corporate
costs were partially offset by $0.2 billion of lower restructuring
and other charges.
Revenues of $3.0 billion decreased $11.5 billion in 2011 as a
$14.9 billion reduction in revenues from NBCU LLC operations
resulting from the deconsolidation of NBCU effective January 28,
2011 and $0.1 billion of lower revenues from other disposed
businesses were partially offset by a $3.7 billion pre-tax gain
related to the NBCU transaction. Operating costs of $0.3 billion
decreased by $0.7 billion in 2011 as $3.6 billion of higher gains
from disposed businesses, primarily the NBCU transaction, and a
$0.6 billion decrease in restructuring, rationalization, acquisition-
related and other charges were partially offset by $1.4 billion
of higher costs of our principal retirement plans, $1.4 billion of
lower earnings from NBCU/NBCU LLC operations and a $0.6 bil-
lion increase in research and development spending and global
corporate costs.
Certain amounts included in Corporate items and eliminations
cost are not allocated to GE operating segments because they are
excluded from the measurement of their operating performance
for internal purposes. For 2012, these included $0.3 billion of gain
related to formation of a joint venture at Aviation and $0.5 billion
of costs at Healthcare, $0.3 billion of costs at Aviation, $0.2 bil-
lion of costs at each of Power & Water and Energy Management,
and $0.1 billion of costs at each of Oil & Gas, Home & Business
Solutions and Transportation, primarily for technology and prod-
uct development costs and restructuring, rationalization and
other charges.
For 2011, these included $0.3 billion at Oil & Gas and $0.1 bil-
lion at Energy Management for acquisition-related costs and
$0.4 billion at Healthcare, $0.2 billion at Power & Water, $0.2 bil-
lion at Aviation and $0.1 billion at each of Energy Management, Oil
& Gas, Home & Business Solutions and Transportation, primarily
for technology and product development costs and restructur-
ing, rationalization and other charges. For 2010, these included
$0.4 billion at Healthcare, $0.2 billion at Home & Business
Solutions, and $0.1 billion at each of Energy Management,
Power & Water and Aviation, primarily for technology and prod-
uct development costs and restructuring, rationalization and
other charges.