GE 2012 Annual Report Download - page 118
Download and view the complete annual report
Please find page 118 of the 2012 GE annual report below. You can navigate through the pages in the report by either clicking on the pages listed below, or by using the keyword search tool below to find specific information within the annual report.-
 1
1 -
2
-
3
-
4
-
5
-
6
-
7
-
8
-
9
-
10
-
11
-
12
-
13
-
14
-
15
-
16
-
17
-
18
-
19
-
20
-
21
-
22
-
23
-
24
-
25
-
26
-
27
-
28
-
29
-
30
-
31
-
32
-
33
-
34
-
35
-
36
-
37
-
38
-
39
-
40
-
41
-
42
-
43
-
44
-
45
-
46
-
47
-
48
-
49
-
50
-
51
-
52
-
53
-
54
-
55
-
56
-
57
-
58
-
59
-
60
-
61
-
62
-
63
-
64
-
65
-
66
-
67
-
68
-
69
-
70
-
71
-
72
-
73
-
74
-
75
-
76
-
77
-
78
-
79
-
80
-
81
-
82
-
83
-
84
-
85
-
86
-
87
-
88
-
89
-
90
-
91
-
92
-
93
-
94
-
95
-
96
-
97
-
98
-
99
-
100
-
101
-
102
-
103
-
104
-
105
-
106
-
107
-
 108
108 -
 109
109 -
 110
110 -
 111
111 -
 112
112 -
 113
113 -
 114
114 -
 115
115 -
 116
116 -
 117
117 -
 118
118 -
 119
119 -
 120
120 -
 121
121 -
 122
122 -
 123
123 -
 124
124 -
 125
125 -
 126
126 -
 127
127 -
 128
128 -
129
-
130
-
131
-
132
-
133
-
134
-
135
-
136
-
137
-
138
-
139
-
140
-
141
-
142
-
143
-
144
-
145
-
146
-
147
-
148
-
149
-
150
 |
 |

116 GE 2012 ANNUAL REPORT
notes to consolidated financial statements
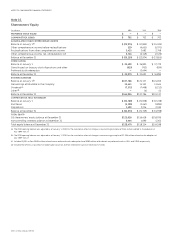
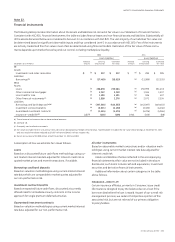
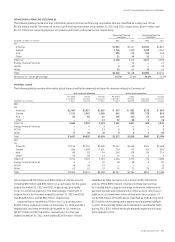
GE’s selling, general and administrative expenses totaled
$17,672 million in 2012, $17,556 million in 2011 and $16,340 mil-
lion in 2010. The increase in 2012 is primarily due to increased
acquisition-related costs, offset by the effects of global cost
reduction initiatives. The increase in 2011 is primarily due to
higher pension costs, increased acquisition-related costs and
increased costs to support global growth, partially offset by the
disposition of NBCU and lower restructuring and other charges.
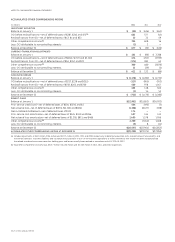
Our Aviation segment enters into collaborative arrange-
ments with manufacturers and suppliers of components used to
build and maintain certain engines, under which GE and these
participants share in risks and rewards of these product pro-
grams. Under these arrangements, participation fees earned and
recorded as other income totaled $35 million, $12 million and
$4 million for the years 2012, 2011 and 2010, respectively. GE’s
payments to participants are recorded as cost of services sold
($593 million, $612 million and $563 million for the years 2012,
2011 and 2010, respectively) or as cost of goods sold ($2,506 mil-
lion, $1,996 million and $1,751 million for the years 2012, 2011 and
2010, respectively).
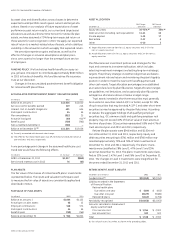
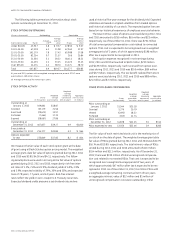
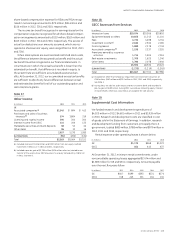
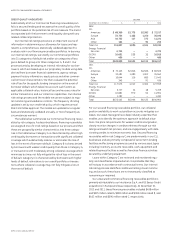
Note 20.
Earnings Per Share Information
2012 2011 2010
(In millions; per-share amounts in dollars) Diluted Basic Diluted Basic Diluted Basic
AMOUNTS ATTRIBUTABLE TO THE COMPANY:
CONSOLIDATED
Earnings from continuing operations for per-share calculation (a) (b) $14,659 $14,659 $14,206 $14,205 $12,588 $12,588
Preferred stock dividends declared (c) ——(1,031) (1,031) (300) (300)
Earnings from continuing operations attributable to common
shareowners for per-share calculation (a) (b) 14,659 14,659 13,174 13,174 12,288 12,288
Earnings (loss) from discontinued operations for per-share calculation (a) (b) (1,035) (1,036) (74) (75) (964) (965)
Net earnings attributable to GE common shareowners for per-share
calculation (a) (b) $13,623 $13,622 $13,098 $13,098 $11,322 $11,322
AVERAGE EQUIVALENT SHARES
Shares of GE common stock outstanding 10,523 10,523 10,591 10,591 10,661 10,661
Employee compensation-related shares, including stock options 41 — 29 — 17 —
Total average equivalent shares 10,564 10,523 10,620 10,591 10,678 10,661
PER-SHARE AMOUNTS
Earnings from continuing operations $ 1.39 $ 1.39 $ 1.24 $ 1.24 $ 1.15 $ 1.15
Earnings (loss) from discontinued operations (0.10) (0.10) (0.01) (0.01) (0.09) (0.09)
Net earnings 1.29 1.29 1.23 1.24 1.06 1.06
Our unvested restricted stock unit awards that contain non-forfeitable rights to dividends or dividend equivalents are considered participating securities and, therefore, are
included in the computation of earnings per share pursuant to the two-class method. Application of this treatment has an insignificant effect.
(a) Included an insignificant amount of dividend equivalents in each of the three years presented.
(b) Included an insignificant amount related to accretion of redeemable securities in 2010.
(c) Included $806 million related to the redemption of our 10% cumulative preferred stock in 2011. See Note 15.
For the years ended December 31, 2012, 2011 and 2010, there
were approximately 292 million, 321 million and 325 million,
respectively, of outstanding stock awards that were not included
in the computation of diluted earnings per share because their
effect was antidilutive.
Earnings-per-share amounts are computed independently
for earnings from continuing operations, earnings (loss) from
discontinued operations and net earnings. As a result, the sum
of per-share amounts from continuing operations and discon-
tinued operations may not equal the total per-share amounts for
net earnings.