GE 2012 Annual Report Download - page 7
Download and view the complete annual report
Please find page 7 of the 2012 GE annual report below. You can navigate through the pages in the report by either clicking on the pages listed below, or by using the keyword search tool below to find specific information within the annual report.-
 1
1 -
 2
2 -
 3
3 -
 4
4 -
 5
5 -
 6
6 -
 7
7 -
 8
8 -
 9
9 -
 10
10 -
 11
11 -
 12
12 -
 13
13 -
 14
14 -
 15
15 -
 16
16 -
 17
17 -
 18
18 -
19
-
20
-
21
-
22
-
23
-
24
-
25
-
26
-
27
-
28
-
29
-
30
-
31
-
32
-
33
-
34
-
35
-
36
-
37
-
38
-
39
-
40
-
41
-
42
-
43
-
44
-
45
-
46
-
47
-
48
-
49
-
50
-
51
-
52
-
53
-
54
-
55
-
56
-
57
-
58
-
59
-
60
-
61
-
62
-
63
-
64
-
65
-
66
-
67
-
68
-
69
-
70
-
71
-
72
-
73
-
74
-
75
-
76
-
77
-
78
-
79
-
80
-
81
-
82
-
83
-
84
-
85
-
86
-
87
-
88
-
89
-
90
-
91
-
92
-
93
-
94
-
95
-
96
-
97
-
98
-
99
-
100
-
101
-
102
-
103
-
104
-
105
-
106
-
107
-
108
-
109
-
110
-
111
-
112
-
113
-
114
-
115
-
116
-
117
-
118
-
119
-
120
-
121
-
122
-
123
-
124
-
125
-
126
-
127
-
128
-
129
-
130
-
131
-
132
-
133
-
134
-
135
-
136
-
137
-
138
-
139
-
140
-
141
-
142
-
143
-
144
-
145
-
146
-
147
-
148
-
149
-
150
 |
 |

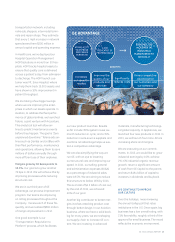
DIVIDEND HISTORY
TOTAL DOLLAR AMOUNT OF DIVIDENDS PAID TO SHAREHOLDERS
1892–1899
1900–1909
1910–1919
1920–1929
1930–1939
1940–1949
1950–1959
1960–1969
1970–1979
1980–1989
1990–1999
2000–2012
TOTAL DIVIDENDS 1892–1999: $45 BILLION
TOTAL DIVIDENDS 2000–2012: $106 BILLION
DOLLARS
IN BILLIONS
$0
$20
$40
$60
$80
$100
$120
At the same time, we are creating a
smaller, more focused financial ser-
vices company—one that has a lower
risk profile and adds value to our
industrial businesses. We will continue
to reduce the size of GE Capital from
the $600 billion of assets it was in 2008
to a goal of $300–$400 billion in the
future. GE Capital has a sound fiscal
position, with Tier 1 capital above 10%
and strong liquidity. We can generate
returns above our cost of capital. Over
the next few years, we plan for GE
Capital to return about $20 billion of
dividends back to the parent. We will
purposefully reallocate capital from
financial services to infrastructure and
grow it faster. Our goal is to have infra-
structure earnings reach 70% of our
total over time.
We have dramatically simplified GE
over the past decade. The last major
portfolio move we made was exit-
ing NBC Universal (NBCU). In the first
phase, we sold 51%, and reallocated
$11 billion from the proceeds to pur-
chase new platforms in Energy and
Oil & Gas. These businesses already
have generated $1 billion of earnings
and are growing 20% annually.
Recently, we announced an agreement
for the disposition of the remainder of
NBCU, and its real estate, for $18.1 bil-
lion. This creates additional cash
for value creation in the short term,
through increased share repurchase
and investment in growth.
Second, we are committed to allo-
cating capital in a balanced and
disciplined way, but with a clear
priority for dividend growth. GE will
generate $100 billion for allocation over
the next few years, including cash from
existing operations, dividends from GE
Capital and dispositions.
The top priority remains growing the
dividend. Since 2000, we have paid out
$106 billion in dividends, more than
any company except Shell, and more
than we paid out in the first 125 years
of the Company combined. We like
GE to have a high dividend yield,
which is appealing to the majority of
our investors.
We plan to buy back shares to get
below 10 billion, where we were before
the crisis. We will make significant
progress toward that goal in 2013 by
allocating a significant portion of the
NBCU cash to repurchase our shares.
In total, we plan to return $18 billion to
investors this year through dividend
and buyback.
We will continue to execute on focused
acquisitions, a capital-efficient way to
grow the Company. We will keep our
focus on acquiring specific capabilities
where GE can add substantial value.
We can execute on a few of these
each year.
Third, we have significantly increased
investment in organic growth, focus-
ing on R&D and global expansion.
In doing so, we have invested ahead
of our competition. We believe that
investing in technology and globaliza-
tion is key to gaining market share.
Annually, we invest more than $10 bil-
lion to launch new products and build
global capability. We make these
investments with the full benefit of
GE’s scale.
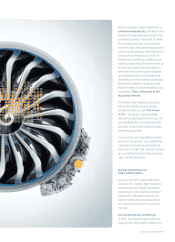
Over the past decade, we have
doubled our annual R&D investment,
increasing $2–$3 billion to 5%–6% of
revenue. Because of this investment,
we have progressed from a company
that can launch one new commercial
engine each decade to a company
that can launch one each year. We
will launch 10 new gas turbines this
decade, significantly more than in
previous times. We are a broader and
deeper technology leader than at any
time in our history.
We have built a company that has
high share in growth regions. In 2012,
we had $40 billion of orders in growth
regions, a 12% increase over the prior
year and a threefold increase in the
last decade.
GE 2012 ANNUAL REPORT 5