GE 2012 Annual Report Download - page 56
Download and view the complete annual report
Please find page 56 of the 2012 GE annual report below. You can navigate through the pages in the report by either clicking on the pages listed below, or by using the keyword search tool below to find specific information within the annual report.-
 1
1 -
2
-
3
-
4
-
5
-
6
-
7
-
8
-
9
-
10
-
11
-
12
-
13
-
14
-
15
-
16
-
17
-
18
-
19
-
20
-
21
-
22
-
23
-
24
-
25
-
26
-
27
-
28
-
29
-
30
-
31
-
32
-
33
-
34
-
35
-
36
-
37
-
38
-
39
-
40
-
41
-
42
-
43
-
44
-
45
-
 46
46 -
 47
47 -
 48
48 -
 49
49 -
 50
50 -
 51
51 -
 52
52 -
 53
53 -
 54
54 -
 55
55 -
 56
56 -
 57
57 -
 58
58 -
 59
59 -
 60
60 -
 61
61 -
 62
62 -
 63
63 -
 64
64 -
 65
65 -
 66
66 -
67
-
68
-
69
-
70
-
71
-
72
-
73
-
74
-
75
-
76
-
77
-
78
-
79
-
80
-
81
-
82
-
83
-
84
-
85
-
86
-
87
-
88
-
89
-
90
-
91
-
92
-
93
-
94
-
95
-
96
-
97
-
98
-
99
-
100
-
101
-
102
-
103
-
104
-
105
-
106
-
107
-
108
-
109
-
110
-
111
-
112
-
113
-
114
-
115
-
116
-
117
-
118
-
119
-
120
-
121
-
122
-
123
-
124
-
125
-
126
-
127
-
128
-
129
-
130
-
131
-
132
-
133
-
134
-
135
-
136
-
137
-
138
-
139
-
140
-
141
-
142
-
143
-
144
-
145
-
146
-
147
-
148
-
149
-
150
 |
 |

management’s discussion and analsis
54 GE 2012 ANNUAL REPORT
CONSUMER—U.S. INSTALLMENT AND REVOLVING CREDIT.
Nonearning receivables of $1.0 billion represented 13.6% of
total nonearning receivables at December 31, 2012. The ratio of
allowance for losses as a percent of nonearning receivables
increased from 202.8% at December 31, 2011, to 222.4% at
December 31, 2012, reflecting an increase in the allowance for
losses primarily due to the use of a more granular portfolio seg-
mentation approach, by loss type, in determining the incurred
loss period, partially offset by an increase in the nonearning
receivables balance. The ratio of nonearning receivables as a
percentage of financing receivables decreased from 2.1% at
December 31, 2011 to 2.0% at December 31, 2012, primarily due
to a higher financing receivables balance, partially offset by an
increase in the nonearning receivables balance.
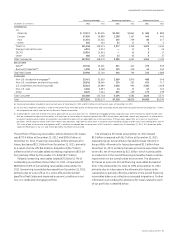
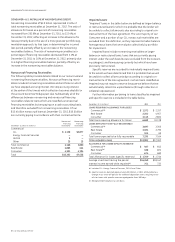
Nonaccrual Financing Receivables
The following table provides details related to our nonaccrual and
nonearning financing receivables. Nonaccrual financing receiv-
ables include all nonearning receivables and are those on which
we have stopped accruing interest. We stop accruing interest
at the earlier of the time at which collection becomes doubtful or
the account becomes 90 days past due. Substantially all of the
differences between nonearning and nonaccrual financing
receivables relate to loans which are classified as nonaccrual
financing receivables but are paying on a cash accounting basis,
and therefore excluded from nonearning receivables. Of our
$13.4 billion nonaccrual loans at December 31, 2012, $10.5 billion
are currently paying in accordance with their contractual terms.
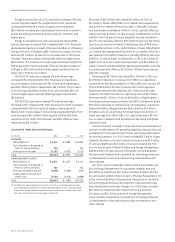
December 31, 2012 (In millions)
Nonaccrual
financing
receivables
Nonearning
financing
receivables
Commercial
CLL $ 4,138 $2,877
Energy Financial Services — —
GECAS 3 —
Other 25 13
Total Commercial 4,166 2,890
Real Estate 4,885 444
Consumer 4,301 4,194
Total $13,352 $7,528
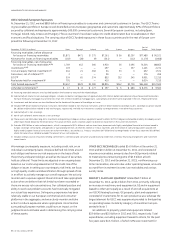
Impaired Loans
“Impaired” loans in the table below are defined as larger-balance
or restructured loans for which it is probable that the lender will
be unable to collect all amounts due according to original con-
tractual terms of the loan agreement. The vast majority of our
Consumer and a portion of our CLL nonaccrual receivables are
excluded from this definition, as they represent smaller-balance
homogeneous loans that we evaluate collectively by portfolio
for impairment.
Impaired loans include nonearning receivables on larger-
balance or restructured loans, loans that are currently paying
interest under the cash basis (but are excluded from the nonearn-
ing category), and loans paying currently but which have been
previously restructured.
Specific reserves are recorded for individually impaired loans
to the extent we have determined that it is probable that we will
be unable to collect all amounts due according to original con-
tractual terms of the loan agreement. Certain loans classified as
impaired may not require a reserve because we believe that we
will ultimately collect the unpaid balance (through collection or
collateral repossession).
Further information pertaining to loans classified as impaired
and specific reserves is included in the table below.
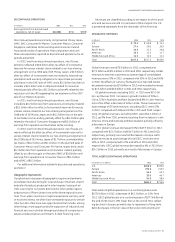
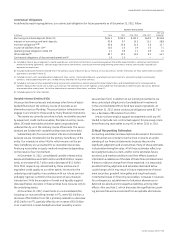
December 31 (In millions) 2012 2011
LOANS REQUIRING ALLOWANCE FOR LOSSES
Commercial (a) $ 1,372 $ 2,357
Real Estate 2,202 4,957
Consumer 3,115 2,824
Total loans requiring allowance for losses 6,689 10,138
LOANS EXPECTED TO BE FULLY RECOVERABLE
Commercial (a) 3,697 3,305
Real Estate 3,491 3,790
Consumer 105 69
Total loans expected to be fully recoverable 7,293 7,164
TOTAL IMPAIRED LOANS $13,982 $17,302
ALLOWANCE FOR LOSSES (SPECIFIC RESERVES)
Commercial (a) $ 487 $ 812
Real Estate (b) 188 822
Consumer 674 680
Total allowance for losses (specific reserves) $ 1,349 $ 2,314
Average investment during the period $16,269 $18,167
Interest income earned while impaired (c) 751 733
(a) Includes CLL, Energy Financial Services, GECAS and Other.
(b) Specific reserves declined approximately $0.3 billion in 2012 attributable to a
change in our write-off policies for collateral dependent loans, requiring write-
offs for loans with specific reserves aged greater than 360 days.
(c) Recognized principally on a cash basis.