GE 2012 Annual Report Download - page 145
Download and view the complete annual report
Please find page 145 of the 2012 GE annual report below. You can navigate through the pages in the report by either clicking on the pages listed below, or by using the keyword search tool below to find specific information within the annual report.-
 1
1 -
2
-
3
-
4
-
5
-
6
-
7
-
8
-
9
-
10
-
11
-
12
-
13
-
14
-
15
-
16
-
17
-
18
-
19
-
20
-
21
-
22
-
23
-
24
-
25
-
26
-
27
-
28
-
29
-
30
-
31
-
32
-
33
-
34
-
35
-
36
-
37
-
38
-
39
-
40
-
41
-
42
-
43
-
44
-
45
-
46
-
47
-
48
-
49
-
50
-
51
-
52
-
53
-
54
-
55
-
56
-
57
-
58
-
59
-
60
-
61
-
62
-
63
-
64
-
65
-
66
-
67
-
68
-
69
-
70
-
71
-
72
-
73
-
74
-
75
-
76
-
77
-
78
-
79
-
80
-
81
-
82
-
83
-
84
-
85
-
86
-
87
-
88
-
89
-
90
-
91
-
92
-
93
-
94
-
95
-
96
-
97
-
98
-
99
-
100
-
101
-
102
-
103
-
104
-
105
-
106
-
107
-
108
-
109
-
110
-
111
-
112
-
113
-
114
-
115
-
116
-
117
-
118
-
119
-
120
-
121
-
122
-
123
-
124
-
125
-
126
-
127
-
128
-
129
-
130
-
131
-
132
-
133
-
134
-
 135
135 -
 136
136 -
 137
137 -
 138
138 -
 139
139 -
 140
140 -
 141
141 -
 142
142 -
 143
143 -
 144
144 -
 145
145 -
 146
146 -
 147
147 -
 148
148 -
 149
149 -
 150
150
 |
 |

of debt to equity because cash balances may be used to reduce
debt and because this long-term debt has equity-like characteris-
tics. The usefulness of this supplemental measure may be limited,
however, as the total amount of cash and equivalents at any point
in time may be different than the amount that could practically be
applied to reduce outstanding debt, and it may not be advanta-
geous or practical to replace certain long-term debt with equity.
Despite these potential limitations, we believe that this measure,
considered along with the corresponding GAAP measure, pro-
vides investors with additional information that may be more
comparable to other financial institutions and businesses.
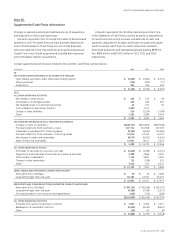
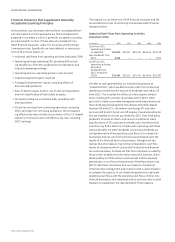
GE Capital Ending Net Investment (ENI), Excluding Cash
and Equivalents
(In billions)
December 31,
2012
January 1,
2009 (a)
GECC total assets $539.2 $661.0
Less assets of discontinued operations 1.1 25.1
Less non-interest bearing liabilities 57.6 85.4
GE Capital ENI 480.5 550.5
Less cash and equivalents 61.9 37.7
GE Capital ENI, excluding cash
and equivalents $418.6 $512.8
(a) As originally reported.
We use ENI to measure the size of our GE Capital segment. We
believe that this measure is a useful indicator of the capital (debt
or equity) required to fund a business as it adjusts for non-
interest bearing current liabilities generated in the normal course
of business that do not require a capital outlay. We also believe
that by excluding cash and equivalents, we provide a meaning-
ful measure of assets requiring capital to fund our GE Capital
segment, as a substantial amount of this cash and equivalents
resulted from debt issuances to pre-fund future debt maturi-
ties and will not be used to fund additional assets. Providing this
measure will help investors measure how we are performing
against our previously communicated goal to reduce the size of
our financial services segment.
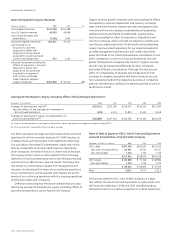
GE Pre-Tax Earnings from Continuing Operations,
Excluding GECC Earnings from Continuing Operations
and the Corresponding Effective Tax Rates
(Dollars in millions) 2012 2011 2010
GE earnings from continuing
operations before income taxes $16,852 $19,231 $15,156
Less GECC earnings from
continuing operations 7,401 6,584 3,120
Total $ 9,451 $12,647 $12,036
GE provision for income taxes $ 2,013 $ 4,839 $ 2,024
GE effective tax rate, excluding
GECC earnings 21.3% 38.3% 16.8%
Reconciliation of U.S. Federal Statutory Income Tax Rate to
GE Effective Tax Rate, Excluding GECC Earnings
2012 2011 2010
U.S. federal statutory income
tax rate 35.0 % 35.0 % 35.0 %
Reduction in rate resulting from
Tax on global activities
including exports (7.6) (7.9) (13.5)
U.S. business credits (1.2) (2.3) (2.8)
NBCU gain — 14.9 —
All other—net (4.9) (1.4) (1.9)
(13.7) 3.3 (18.2)
GE effective tax rate, excluding
GECC earnings 21.3 % 38.3 % 16.8 %
We believe that the GE effective tax rate is best analyzed in rela-
tion to GE earnings before income taxes excluding the GECC net
earnings from continuing operations, as GE tax expense does not
include taxes on GECC earnings. Management believes that in addi-
tion to the Consolidated and GECC tax rates shown in Note 14, this
supplemental measure provides investors with useful information
as it presents the GE effective tax rate that can be used in compar-
ing the GE results to other non-financial services businesses.
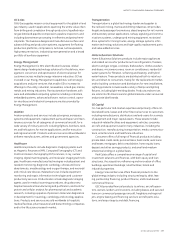
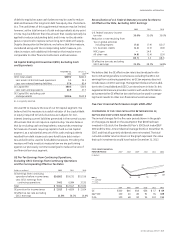
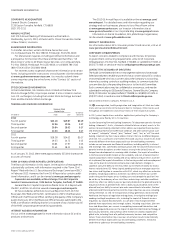
Five-Year Financial Performance Graph: 2008–2012
COMPARISON OF FIVE-YEAR CUMULATIVE RETURN AMONG GE,
S&P 500 AND DOW JONES INDUSTRIAL AVERAGE
The annual changes for the five-year period shown in the graph
on this page are based on the assumption that $100 had been
invested in GE stock, the Standard & Poor’s 500 Stock Index (S&P
500) and the Dow Jones Industrial Average (DJIA) on December 31,
2007, and that all quarterly dividends were reinvested. The total
cumulative dollar returns shown on the graph represent the value
that such investments would have had on December 31, 2012.
FIVE-YEAR FINANCIAL
PERFORMANCE
(In dollars)
GE
S&P 500
DJIA
57
56
46
46
100
69
2007 2008 2009 2010 2011 2012
GE $100 $46 $46 $56 $ 57 $ 69
S&P 500 100 63 80 92 94 109
DJIA 100 68 83 95 103 114
2007 2008 2009 2010 2011 2012
GE 2012 ANNUAL REPORT 143
supplemental information