Dollar General 2003 Annual Report Download - page 48
Download and view the complete annual report
Please find page 48 of the 2003 Dollar General annual report below. You can navigate through the pages in the report by either clicking on the pages listed below, or by using the keyword search tool below to find specific information within the annual report.-
 1
1 -
2
-
3
-
4
-
5
-
6
-
7
-
8
-
9
-
10
-
11
-
12
-
13
-
14
-
15
-
16
-
17
-
18
-
19
-
20
-
21
-
22
-
23
-
24
-
25
-
26
-
27
-
28
-
29
-
30
-
31
-
32
-
33
-
34
-
35
-
36
-
37
-
 38
38 -
 39
39 -
 40
40 -
 41
41 -
 42
42 -
 43
43 -
 44
44 -
 45
45 -
 46
46 -
 47
47 -
 48
48 -
 49
49 -
 50
50 -
 51
51 -
 52
52 -
 53
53 -
 54
54
 |
 |

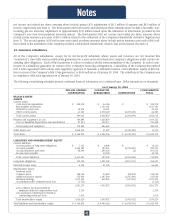
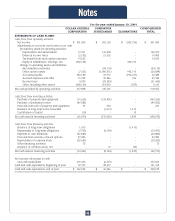
For the year ended January 31, 2003
–––––––––––––––––––––––––––––––––––––––––––––––––––––––––––––––––––––––––––––––––––––––––––––––––––––––––––––––––––––––––––––––––––––––––––––––––––––––––––––––––––––––-
DOLLAR GENERAL GUARANTOR CONSOLIDATED
CORPORATION SUBSIDIARIES ELIMINATIONS TOTAL
–––––––––––––––––––––––––––––––––––––––––––––––––––––––––––––––––––––––––––––––––––––––––––––––––––––––––––––––––––––––––––––––––––––––––––––––––––––––––––––––––––––––-
STATEMENTS OF CASH FLOWS:
Cash flows from operating activities:
Net income $264,946 $ 253,720 $ (253,720) $ 264,946
Adjustments to reconcile net income to net cash
provided by operating activities:
Depreciation and amortization 15,222 119,737 - 134,959
Deferred income taxes 63,204 19,663 - 82,867
Tax benefit from stock option exercises 2,372 - - 2,372
Litigation settlement (162,000) - - (162,000)
Equity in subsidiaries’ earnings, net (253,720) - 253,720 -
Change in operating assets and liabilities:
Merchandise inventories - 7,992 - 7,992
Other current assets (5,605) (350,209) 368,380 12,566
Accounts payable 532,305 (147,694) (365,771) 18,840
Accrued expenses and other (20,113) 35,467 (744) 14,610
Income taxes (10,493) 66,951 - 56,458
Other 6,255 (3,960) (1,865) 430
–––––––––––––––––––––––––––––––––––––––––––––––––––––––––––––––––––––––––––––––––––––––––––––––––––––––––––––––––––––––––––––––––––––––––––––––––––––––––––––––––––––––
Net cash provided by operating activities 432,373 1,667 - 434,040
–––––––––––––––––––––––––––––––––––––––––––––––––––––––––––––––––––––––––––––––––––––––––––––––––––––––––––––––––––––––––––––––––––––––––––––––––––––––––––––––––––––––
Cash flows from investing activities:
Purchase of property and equipment (12,949) (121,366) - (134,315)
Proceeds from sale of property and equipment 270 211 - 481
Issuance of long-term notes receivable (130,152) - 130,152 -
Contribution of capital (317,602) - 317,602 -
–––––––––––––––––––––––––––––––––––––––––––––––––––––––––––––––––––––––––––––––––––––––––––––––––––––––––––––––––––––––––––––––––––––––––––––––––––––––––––––––––––––––
Net cash used in investing activities (460,433) (121,155) 447,754 (133,834)
–––––––––––––––––––––––––––––––––––––––––––––––––––––––––––––––––––––––––––––––––––––––––––––––––––––––––––––––––––––––––––––––––––––––––––––––––––––––––––––––––––––––
Cash flows from financing activities:
Issuance of long-term obligations - 130,152 (130,152) -
Repayments of long-term obligations (73,361) (323,733) - (397,094)
Payment of cash dividends (42,638) - - (42,638)
Proceeds from exercise of stock options 5,021 - - 5,021
Other financing activities (5,702) - - (5,702)
Issuance of common stock, net - 317,602 (317,602) -
–––––––––––––––––––––––––––––––––––––––––––––––––––––––––––––––––––––––––––––––––––––––––––––––––––––––––––––––––––––––––––––––––––––––––––––––––––––––––––––––––––––––
Net cash provided by (used in) financing activities (116,680) 124,021 (447,754) (440,413)
–––––––––––––––––––––––––––––––––––––––––––––––––––––––––––––––––––––––––––––––––––––––––––––––––––––––––––––––––––––––––––––––––––––––––––––––––––––––––––––––––––––––
Net increase (decrease) in cash and
cash equivalents (144,740) 4,533 - (140,207)
Cash and cash equivalents, beginning of year 217,539 43,986 - 261,525
–––––––––––––––––––––––––––––––––––––––––––––––––––––––––––––––––––––––––––––––––––––––––––––––––––––––––––––––––––––––––––––––––––––––––––––––––––––––––––––––––––––––
Cash and cash equivalents, end of year $ 72,799 $ 48,519 $ - $ 121,318
–––––––––––––––––––––––––––––––––––––––––––––––––––––––––––––––––––––––––––––––––––––––––––––––––––––––––––––––––––––––––––––––––––––––––––––––––––––––––––––––––––––––
–––––––––––––––––––––––––––––––––––––––––––––––––––––––––––––––––––––––––––––––––––––––––––––––––––––––––––––––––––––––––––––––––––––––––––––––––––––––––––––––––––––––
Notes
46
$
cash