Dollar General 2003 Annual Report Download - page 13
Download and view the complete annual report
Please find page 13 of the 2003 Dollar General annual report below. You can navigate through the pages in the report by either clicking on the pages listed below, or by using the keyword search tool below to find specific information within the annual report.-
 1
1 -
2
-
 3
3 -
 4
4 -
 5
5 -
 6
6 -
 7
7 -
 8
8 -
 9
9 -
 10
10 -
 11
11 -
 12
12 -
 13
13 -
 14
14 -
 15
15 -
 16
16 -
 17
17 -
 18
18 -
 19
19 -
 20
20 -
 21
21 -
 22
22 -
 23
23 -
24
-
25
-
26
-
27
-
28
-
29
-
30
-
31
-
32
-
33
-
34
-
35
-
36
-
37
-
38
-
39
-
40
-
41
-
42
-
43
-
44
-
45
-
46
-
47
-
48
-
49
-
50
-
51
-
52
-
53
-
54
 |
 |

•The effectiveness of its newly formed global sourcing subsidiary that replaces certain aspects of its importing process
which had previously been outsourced to a third party;
•The Company’s plans to install some additional fixtures in over three-quarters of its existing stores and the potential for
this disruption to have a temporary negative impact on same-store sales; and
•The Company’s progress toward fulfilling its Sarbanes-Oxley internal controls certification process which must be
completed before the filing of its annual report on Form 10-K in early 2005.
The Company measures itself against seven key financial metrics that it believes provide a well-balanced perspective regarding its
overall financial health. Those metrics are as follows, together with how they are computed:
•Earnings per share ("EPS") growth (current year EPS minus prior year EPS divided by prior year EPS equals percentage
change) which is an indicator of the increased returns generated for the Company’s shareholders.
•Total net sales growth (current year total net sales minus prior year total net sales divided by prior year total net sales
equals percentage change) which indicates, among other things, the success of the Company’s selection of new store
locations and merchandising strategies.
•Operating margin rate (operating profit divided by net sales) which is an indicator of the Company’s success in leveraging
its fixed costs and managing its variable costs.
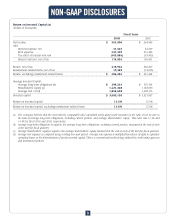
•Return on invested capital (numerator – net income plus interest expense, net of tax, plus rent expense, net of tax;
denominator – average long-term debt plus average shareholders’ equity, both measured at the end of the latest five fiscal
quarters, plus average rent expense multiplied by eight. Average rent expense is computed using a two-year period).
Although this measure is a non-GAAP measure, the Company believes it is useful because return on invested capital
measures the efficiency of the Company’s capital deployed in its operations.
•Free cash flow (the sum of net cash flows from operating activities, net cash flows from investing activities and net cash
flows from financing activities, excluding share repurchases and changes in debt other than required payments). Although
this measure is a non-GAAP measure, the Company believes it is useful as an indicator of the cash flow generating
capacity of the Company’s operations. It is also a useful metric to analyze in conjunction with net income to determine
whether there is any significant non-cash component to the Company’s net income.
• Inventory turns (cost of goods sold for the year divided by average inventory balances, at cost, measured at the end of the
latest five fiscal quarters) which is an indicator of how well the Company is managing the largest asset on its balance sheet.
•Return on average assets (net income for the year divided by average total assets, measured at the end of the latest five
fiscal quarters), an overall indicator of the Company’s effectiveness in deploying its resources.
The Company computes the above metrics using both GAAP and certain non-GAAP information. As discussed further below under
"Results of Operations", the Company generally excludes non-recurring items, such as the restatement-related items, to more effec-
tively evaluate the Company’s performance on a comparable and ongoing basis.
The Company also pays particular attention to its same-store sales growth, which is a sub-category of its total sales growth, and
its shrink performance, which is a sub-category of its operating margin rate. In 2003 and 2002, the Company experienced same-
store sales growth of 4.0% and 5.7%, respectively. In 2003 and 2002, the Company’s shrink, expressed in retail dollars as a per-
centage of sales, was 3.05% and 3.52%, respectively.
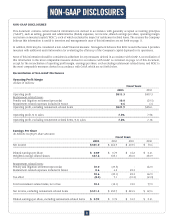
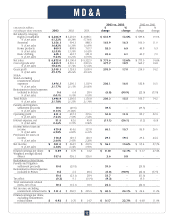
Results of Operations
The following discussion of the Company’s financial performance is based on the Consolidated Financial Statements set forth here-
in. The Company has included in this document certain financial information not derived in accordance with generally accepted
accounting principles ("GAAP"), such as selling, general and administrative ("SG&A") expenses, net income and diluted earnings
per share that exclude the impact of restatement-related items. The Company believes that this information is useful to investors
as it indicates more clearly the Company’s comparative year-to-year operating results. This information should not be considered
a substitute for any measures derived in accordance with GAAP. Management may use this information to better understand the
Company’s underlying operating results.
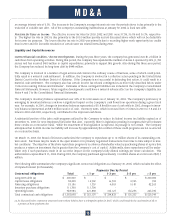
The following table contains results of operations data for the 2003, 2002 and 2001 fiscal years, and the dollar and percentage vari-
ances among those years:
M D & A
11