Dollar General 2003 Annual Report Download - page 46
Download and view the complete annual report
Please find page 46 of the 2003 Dollar General annual report below. You can navigate through the pages in the report by either clicking on the pages listed below, or by using the keyword search tool below to find specific information within the annual report.-
 1
1 -
2
-
3
-
4
-
5
-
6
-
7
-
8
-
9
-
10
-
11
-
12
-
13
-
14
-
15
-
16
-
17
-
18
-
19
-
20
-
21
-
22
-
23
-
24
-
25
-
26
-
27
-
28
-
29
-
30
-
31
-
32
-
33
-
34
-
35
-
 36
36 -
 37
37 -
 38
38 -
 39
39 -
 40
40 -
 41
41 -
 42
42 -
 43
43 -
 44
44 -
 45
45 -
 46
46 -
 47
47 -
 48
48 -
 49
49 -
 50
50 -
 51
51 -
 52
52 -
 53
53 -
 54
54
 |
 |

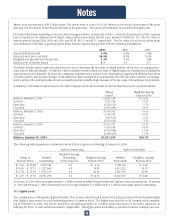
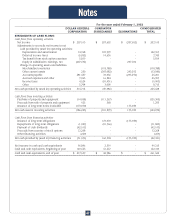
For the year ended January 30, 2004
–––––––––––––––––––––––––––––––––––––––––––––––––––––––––––––––––––––––––––––––––––––––––––––––––––––––––––––––––––––––––––––––––––––––––––––––––––––––––––––––––––––––-
DOLLAR GENERAL GUARANTOR CONSOLIDATED
CORPORATION SUBSIDIARIES ELIMINATIONS TOTAL
–––––––––––––––––––––––––––––––––––––––––––––––––––––––––––––––––––––––––––––––––––––––––––––––––––––––––––––––––––––––––––––––––––––––––––––––––––––––––––––––––––––––-
STATEMENTS OF INCOME:
Net sales $ 169,467 $ 6,871,992 $ (169,467) $ 6,871,992
Cost of goods sold - 4,853,863 - 4,853,863
–––––––––––––––––––––––––––––––––––––––––––––––––––––––––––––––––––––––––––––––––––––––––––––––––––––––––––––––––––––––––––––––––––––––––––––––––––––––––––––––––––––––
Gross profit 169,467 2,018,129 (169,467) 2,018,129
Selling, general and administrative 132,445 1,533,888 (169,467) 1,496,866
Penalty expense 10,000 - - 10,000
–––––––––––––––––––––––––––––––––––––––––––––––––––––––––––––––––––––––––––––––––––––––––––––––––––––––––––––––––––––––––––––––––––––––––––––––––––––––––––––––––––––––
Operating profit 27,022 484,241 - 511,263
Interest expense, net 21,616 9,887 - 31,503
–––––––––––––––––––––––––––––––––––––––––––––––––––––––––––––––––––––––––––––––––––––––––––––––––––––––––––––––––––––––––––––––––––––––––––––––––––––––––––––––––––––––
Income before taxes on income 5,406 474,354 - 479,760
Provisions for taxes on income 6,560 172,200 - 178,760
Equity in subsidiaries’ earnings, net of taxes 302,154 - (302,154) -
–––––––––––––––––––––––––––––––––––––––––––––––––––––––––––––––––––––––––––––––––––––––––––––––––––––––––––––––––––––––––––––––––––––––––––––––––––––––––––––––––––––––
Net income $ 301,000 $ 302,154 $ (302,154) $ 301,000
–––––––––––––––––––––––––––––––––––––––––––––––––––––––––––––––––––––––––––––––––––––––––––––––––––––––––––––––––––––––––––––––––––––––––––––––––––––––––––––––––––––––
–––––––––––––––––––––––––––––––––––––––––––––––––––––––––––––––––––––––––––––––––––––––––––––––––––––––––––––––––––––––––––––––––––––––––––––––––––––––––––––––––––––––
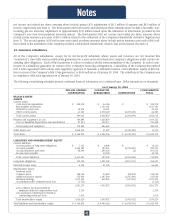
For the year ended January 31, 2003
–––––––––––––––––––––––––––––––––––––––––––––––––––––––––––––––––––––––––––––––––––––––––––––––––––––––––––––––––––––––––––––––––––––––––––––––––––––––––––––––––––––––-
DOLLAR GENERAL GUARANTOR CONSOLIDATED
CORPORATION SUBSIDIARIES ELIMINATIONS TOTAL
–––––––––––––––––––––––––––––––––––––––––––––––––––––––––––––––––––––––––––––––––––––––––––––––––––––––––––––––––––––––––––––––––––––––––––––––––––––––––––––––––––––––-
STATEMENTS OF INCOME:
Net sales $ 130,152 $ 6,100,404 $ (130,152) $ 6,100,404
Cost of goods sold - 4,376,138 - 4,376,138
–––––––––––––––––––––––––––––––––––––––––––––––––––––––––––––––––––––––––––––––––––––––––––––––––––––––––––––––––––––––––––––––––––––––––––––––––––––––––––––––––––––––
Gross profit 130,152 1,724,266 (130,152) 1,724,266
Selling, general and administrative 114,903 1,311,791 (130,152) 1,296,542
Proceeds from litigation settlement (29,541) - - (29,541)
–––––––––––––––––––––––––––––––––––––––––––––––––––––––––––––––––––––––––––––––––––––––––––––––––––––––––––––––––––––––––––––––––––––––––––––––––––––––––––––––––––––––
Operating profit 44,790 412,475 - 457,265
Interest expense, net 26,930 15,709 - 42,639
–––––––––––––––––––––––––––––––––––––––––––––––––––––––––––––––––––––––––––––––––––––––––––––––––––––––––––––––––––––––––––––––––––––––––––––––––––––––––––––––––––––––
Income before taxes on income 17,860 396,766 - 414,626
Provisions for taxes on income 6,634 143,046 - 149,680
Equity in subsidiaries’ earnings, net of taxes 253,720 - (253,720) -
–––––––––––––––––––––––––––––––––––––––––––––––––––––––––––––––––––––––––––––––––––––––––––––––––––––––––––––––––––––––––––––––––––––––––––––––––––––––––––––––––––––––
Net income $ 264,946 $ 253,720 $ (253,720) $ 264,946
–––––––––––––––––––––––––––––––––––––––––––––––––––––––––––––––––––––––––––––––––––––––––––––––––––––––––––––––––––––––––––––––––––––––––––––––––––––––––––––––––––––––
–––––––––––––––––––––––––––––––––––––––––––––––––––––––––––––––––––––––––––––––––––––––––––––––––––––––––––––––––––––––––––––––––––––––––––––––––––––––––––––––––––––––
For the year ended February 1, 2002
–––––––––––––––––––––––––––––––––––––––––––––––––––––––––––––––––––––––––––––––––––––––––––––––––––––––––––––––––––––––––––––––––––––––––––––––––––––––––––––––––––––––-
DOLLAR GENERAL GUARANTOR CONSOLIDATED
CORPORATION SUBSIDIARIES ELIMINATIONS TOTAL
–––––––––––––––––––––––––––––––––––––––––––––––––––––––––––––––––––––––––––––––––––––––––––––––––––––––––––––––––––––––––––––––––––––––––––––––––––––––––––––––––––––––-
STATEMENTS OF INCOME:
Net sales $ 173,070 $ 5,322,895 $ (173,070) $ 5,322,895
Cost of goods sold - 3,813,483 - 3,813,483
–––––––––––––––––––––––––––––––––––––––––––––––––––––––––––––––––––––––––––––––––––––––––––––––––––––––––––––––––––––––––––––––––––––––––––––––––––––––––––––––––––––––
Gross profit 173,070 1,509,412 (173,070) 1,509,412
Selling, general and administrative 154,362 1,154,509 (173,070) 1,135,801
–––––––––––––––––––––––––––––––––––––––––––––––––––––––––––––––––––––––––––––––––––––––––––––––––––––––––––––––––––––––––––––––––––––––––––––––––––––––––––––––––––––––
Operating profit 18,708 354,903 - 373,611
Interest expense, net 18,913 26,876 - 45,789
–––––––––––––––––––––––––––––––––––––––––––––––––––––––––––––––––––––––––––––––––––––––––––––––––––––––––––––––––––––––––––––––––––––––––––––––––––––––––––––––––––––––
Income (loss) before taxes on income (205) 328,027 - 327,822
Provisions (benefit) for taxes on income (26) 120,335 - 120,309
Equity in subsidiaries’ earnings, net of taxes 207,692 - (207,692) -
–––––––––––––––––––––––––––––––––––––––––––––––––––––––––––––––––––––––––––––––––––––––––––––––––––––––––––––––––––––––––––––––––––––––––––––––––––––––––––––––––––––––
Net income $ 207,513 $ 207,692 $ (207,692) $ 207,513
–––––––––––––––––––––––––––––––––––––––––––––––––––––––––––––––––––––––––––––––––––––––––––––––––––––––––––––––––––––––––––––––––––––––––––––––––––––––––––––––––––––––
–––––––––––––––––––––––––––––––––––––––––––––––––––––––––––––––––––––––––––––––––––––––––––––––––––––––––––––––––––––––––––––––––––––––––––––––––––––––––––––––––––––––
Notes
44