Dollar General 2003 Annual Report Download - page 35
Download and view the complete annual report
Please find page 35 of the 2003 Dollar General annual report below. You can navigate through the pages in the report by either clicking on the pages listed below, or by using the keyword search tool below to find specific information within the annual report.-
 1
1 -
2
-
3
-
4
-
5
-
6
-
7
-
8
-
9
-
10
-
11
-
12
-
13
-
14
-
15
-
16
-
17
-
18
-
19
-
20
-
21
-
22
-
23
-
24
-
 25
25 -
 26
26 -
 27
27 -
 28
28 -
 29
29 -
 30
30 -
 31
31 -
 32
32 -
 33
33 -
 34
34 -
 35
35 -
 36
36 -
 37
37 -
 38
38 -
 39
39 -
 40
40 -
 41
41 -
 42
42 -
 43
43 -
 44
44 -
 45
45 -
46
-
47
-
48
-
49
-
50
-
51
-
52
-
53
-
54
 |
 |

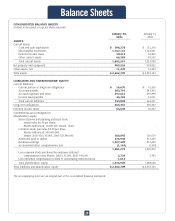
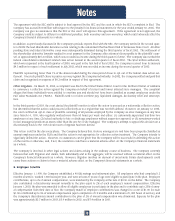
consolidated balance sheets. The other two DCs, excluding the equipment, have been recorded as operating leases in accordance
with SFAS No. 98, "Accounting for Leases." Based upon the guidance included when FIN 46 was originally released, the Company
adopted the provisions of FIN 46 on August 2, 2003 and the adoption of FIN 46 did not have a material effect on the Company’s
financial statements as a whole.
Reclassifications
Certain reclassifications of the 2001 and 2002 amounts have been made to conform to the 2003 presentation.
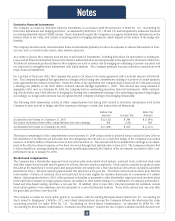
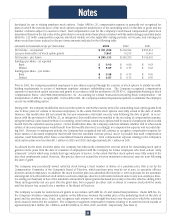
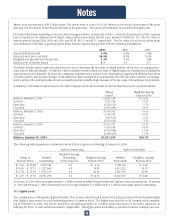
2. Property and equipment
Property and equipment is recorded at cost and summarized as follows:
(In thousands) 2003 2002
–––––––––––––––––––––––––––––––––––––––––––––––––––––––––––––––––––––––––––––––––––––––––––––––––––––––––––––––––––––––––––––––––––––––––––––––––––––––––––––––––––––––-
Land and land improvements $ 145,605 $ 145,508
Buildings 333,765 333,764
Leasehold improvements 170,895 157,014
Furniture, fixtures and equipment 1,039,946 940,323
Construction in progress 19,511 1,214
–––––––––––––––––––––––––––––––––––––––––––––––––––––––––––––––––––––––––––––––––––––––––––––––––––––––––––––––––––––––––––––––––––––––––––––––––––––––––––––––––––––––-
1,709,722 1,577,823
Less accumulated depreciation and amortization 720,498 584,001
–––––––––––––––––––––––––––––––––––––––––––––––––––––––––––––––––––––––––––––––––––––––––––––––––––––––––––––––––––––––––––––––––––––––––––––––––––––––––––––––––––––––-
Net property and equipment $ 989,224 $ 993,822
–––––––––––––––––––––––––––––––––––––––––––––––––––––––––––––––––––––––––––––––––––––––––––––––––––––––––––––––––––––––––––––––––––––––––––––––––––––––––––––––––––––––-
–––––––––––––––––––––––––––––––––––––––––––––––––––––––––––––––––––––––––––––––––––––––––––––––––––––––––––––––––––––––––––––––––––––––––––––––––––––––––––––––––––––––-
Depreciation expense related to property and equipment was approximately $148.8 million, $135.3 million and $122.3 million in
2003, 2002 and 2001, respectively. Amortization of capital lease assets is included in depreciation expense.
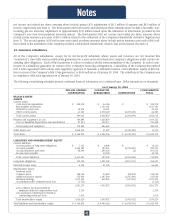
3. Accrued expenses and other
Accrued expenses and other consist of the following:
(In thousands) 2003 2002
–––––––––––––––––––––––––––––––––––––––––––––––––––––––––––––––––––––––––––––––––––––––––––––––––––––––––––––––––––––––––––––––––––––––––––––––––––––––––––––––––––––––-
Compensation and benefits $ 78,374 $ 63,868
Insurance 97,104 73,528
Taxes (other than taxes on income) 35,859 29,695
Other 86,279 72,807
–––––––––––––––––––––––––––––––––––––––––––––––––––––––––––––––––––––––––––––––––––––––––––––––––––––––––––––––––––––––––––––––––––––––––––––––––––––––––––––––––––––––-
$ 297,616 $ 239,898
–––––––––––––––––––––––––––––––––––––––––––––––––––––––––––––––––––––––––––––––––––––––––––––––––––––––––––––––––––––––––––––––––––––––––––––––––––––––––––––––––––––––-
–––––––––––––––––––––––––––––––––––––––––––––––––––––––––––––––––––––––––––––––––––––––––––––––––––––––––––––––––––––––––––––––––––––––––––––––––––––––––––––––––––––––-
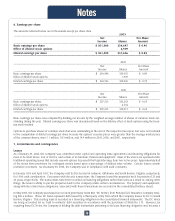
4. Income taxes
The provision for taxes on income consists of the following:
(In thousands) 2003 2002 2001
–––––––––––––––––––––––––––––––––––––––––––––––––––––––––––––––––––––––––––––––––––––––––––––––––––––––––––––––––––––––––––––––––––––––––––––––––––––––––––––––––––––––-
Current:
Federal $ 145,072 $ 55,646 $ 103,988
State 13,838 11,167 8,578
–––––––––––––––––––––––––––––––––––––––––––––––––––––––––––––––––––––––––––––––––––––––––––––––––––––––––––––––––––––––––––––––––––––––––––––––––––––––––––––––––––––––-
158,910 66,813 112,566
–––––––––––––––––––––––––––––––––––––––––––––––––––––––––––––––––––––––––––––––––––––––––––––––––––––––––––––––––––––––––––––––––––––––––––––––––––––––––––––––––––––––-
Deferred:
Federal 18,365 83,138 5,823
State 1,485 (271) 1,920
–––––––––––––––––––––––––––––––––––––––––––––––––––––––––––––––––––––––––––––––––––––––––––––––––––––––––––––––––––––––––––––––––––––––––––––––––––––––––––––––––––––––-
19,850 82,867 7,743
–––––––––––––––––––––––––––––––––––––––––––––––––––––––––––––––––––––––––––––––––––––––––––––––––––––––––––––––––––––––––––––––––––––––––––––––––––––––––––––––––––––––-
$ 178,760 $ 149,680 $ 120,309
–––––––––––––––––––––––––––––––––––––––––––––––––––––––––––––––––––––––––––––––––––––––––––––––––––––––––––––––––––––––––––––––––––––––––––––––––––––––––––––––––––––––-
–––––––––––––––––––––––––––––––––––––––––––––––––––––––––––––––––––––––––––––––––––––––––––––––––––––––––––––––––––––––––––––––––––––––––––––––––––––––––––––––––––––––-
Notes
33